nVision Animal Tracking Model
This tool uses 2.0 compute credits per hour.
This tool applies a deep learning model on behavioral movies, extracting bounding box estimates of the animal subject. The deep learning model used by the tool is the same model used in nVision systems for real-time tracking. This tool enables running the nVision tracking model post-acquisition, which is different from the real-time processing that occurs in IDAS during acquisition.
The deep learning model is based on an animal tracking model in the NVIDA Deepstream SDK. The bounding box estimates of the model can be used as a proxy for animal center of mass (COM), which can then be used for further analysis, such as computing speed or labeling states of rest and movement.
Parameters
| Parameter | Required? | Default | Description |
|---|---|---|---|
| Movie Filenames | True | N/A | File names of the behavior movie to process. accepted formats are: .isxb |
| Time Ref | True | start | The format of frames timestamps for the output. Options include: tsc, start, unix |
| Generate MP4 | True | True | Flag indicating whether to generate an MP4 movie with the tracking results annotated on the input movie |
| Display Label | True | False | Flag indicating whether to display a label for the detected object |
| Display Bounding Box | True | True | Flag indicating whether to display the bounding box |
| Bounding Box Color | True | 255;0;0;255 | The color of the bounding box, formatted as the following string: ' |
| Bounding Box Border Width | True | 1 | The border width of the bounding box in units of pixels |
| Display Bounding Box Center | True | True | Flag indicating whether to display the bounding box center point |
| Bounding Box Center Color | True | 255;0;0;255 | The color of the bounding box center point, formatted as the following string: ' |
| Bounding Box Center Radius | True | 1.0 | The radius of the bounding box center point in units of pixels |
| Confidence Threshold | False | 0.0 | Do not visualize estimates with confidence below this threshold. |
Details
Inputs
The tool expects inputs to be nVision, behavioral movies, in .isxb file format.
The nVision movies do not need to have existing tracking data in order to run the model.
The tool is also compatible with series inputs.
Valid Inputs
| Source Parameter | File Type | File Format |
|---|---|---|
| Movie Filenames | nvision_movie | isxb |
Time Ref
This parameter represents the time reference to use for the timestamps in the output annotations.
Time Ref can be one of the following values:
start: The timestamps represent the seconds since the start of the input movie. If this option is chosen, the timestamps will be in a column namedFrame Timestamp (s).unix: The timestamps represent the seconds since the Unix epoch. If this option is chosen, the timestamps will be in a column namedFrame Timestamp (s).tsc: The timestamps represent the hardware counter values generated during acquisition from IDAS. These values are stored in the metadata of the input.isxbfiles. If this option is chosen, the timestamps will be in a column namedHardware counter (us). This column is always included in the output annotations, because it's necessary in the downstream Map Annotations To ISXD Data tool, in order to map the behavior annotations originating from this tool, with a cell set file from a corresponding, synchronized recording. Read more about synchronization in the Next Steps section.
Outputs
Experiment Annotations
The tracking results of the nVision model are output in IDEAS experiment annotations format. This file will contain one row for every frame of the input movie, and the following columns for each row:
- Global Frame Number: The frame number within the movie series
- Movie Number: The movie number that the frame is from, within the movie series
- Local Frame Number: The frame number within the individual movie
- Frame Timestamp: The timestamp of the frame, derived from the hardware frame timestamps stored by IDAS during acquisition. This can be in units of
usif the inputTime Refparameter istsc, otherwise the units ares. - Bounding Box Left: The left (x) coordinate of the bounding box identified by the model, in units of pixels.
- Bounding Box Top: The top (y) coordinate of the bounding box identified by the model, in units of pixels.
- Bounding Box Right: The right (x) coordinate of the bounding box identified by the model, in units of pixels.
- Bounding Box Bottom: The bottom (y) coordinate of the bounding box identified by the model, in units of pixels.
- Bounding Box Center X: The center (x) coordinate of the bounding box identified by the model, in units of pixels.
- Bounding Box Center Y: The center (y) coordinate of the bounding box identified by the model, in units of pixels.
- Confidence: The confidence of the model, in units of percentage (%).
If the model is unable to identify the subject, then the bounding box and confidence columns will be empty. The following table shows an example of this output file.
| Global Frame Number | Movie Number | Local Frame Number | Frame Timestamp (us) | Bounding Box Left | Bounding Box Top | Bounding Box Right | Bounding Box Bottom | Bounding Box Center X | Bounding Box Center Y | Confidence |
|---|---|---|---|---|---|---|---|---|---|---|
| 0 | 0 | 0 | 90310284262 | 887.191 | 821.462 | 1044.55 | 933.184 | 965.87 | 877.323 | 95.2393 |
| 1 | 0 | 1 | 90310352280 | 886.916 | 821.542 | 1044.56 | 932.717 | 965.736 | 877.13 | 96.2198 |
| 2 | 0 | 2 | 90310420240 | 887.849 | 820.654 | 1045.88 | 932.73 | 966.866 | 876.692 | 90.9167 |
| 3 | 0 | 3 | 90310484246 | 887.791 | 821.562 | 1044.36 | 932.987 | 966.075 | 877.274 | 94.1648 |
| 4 | 0 | 4 | 90310552256 | 887.774 | 820.646 | 1045.26 | 932.501 | 966.518 | 876.573 | 92.9656 |
| 5 | 0 | 5 | 90310620240 | 888.449 | 822.21 | 1043.77 | 932.21 | 966.107 | 877.21 | 91.9386 |
| ... | ... | ... | ... | ... | ... | ... | ... | ... | ... | ... |
Annotated Movie
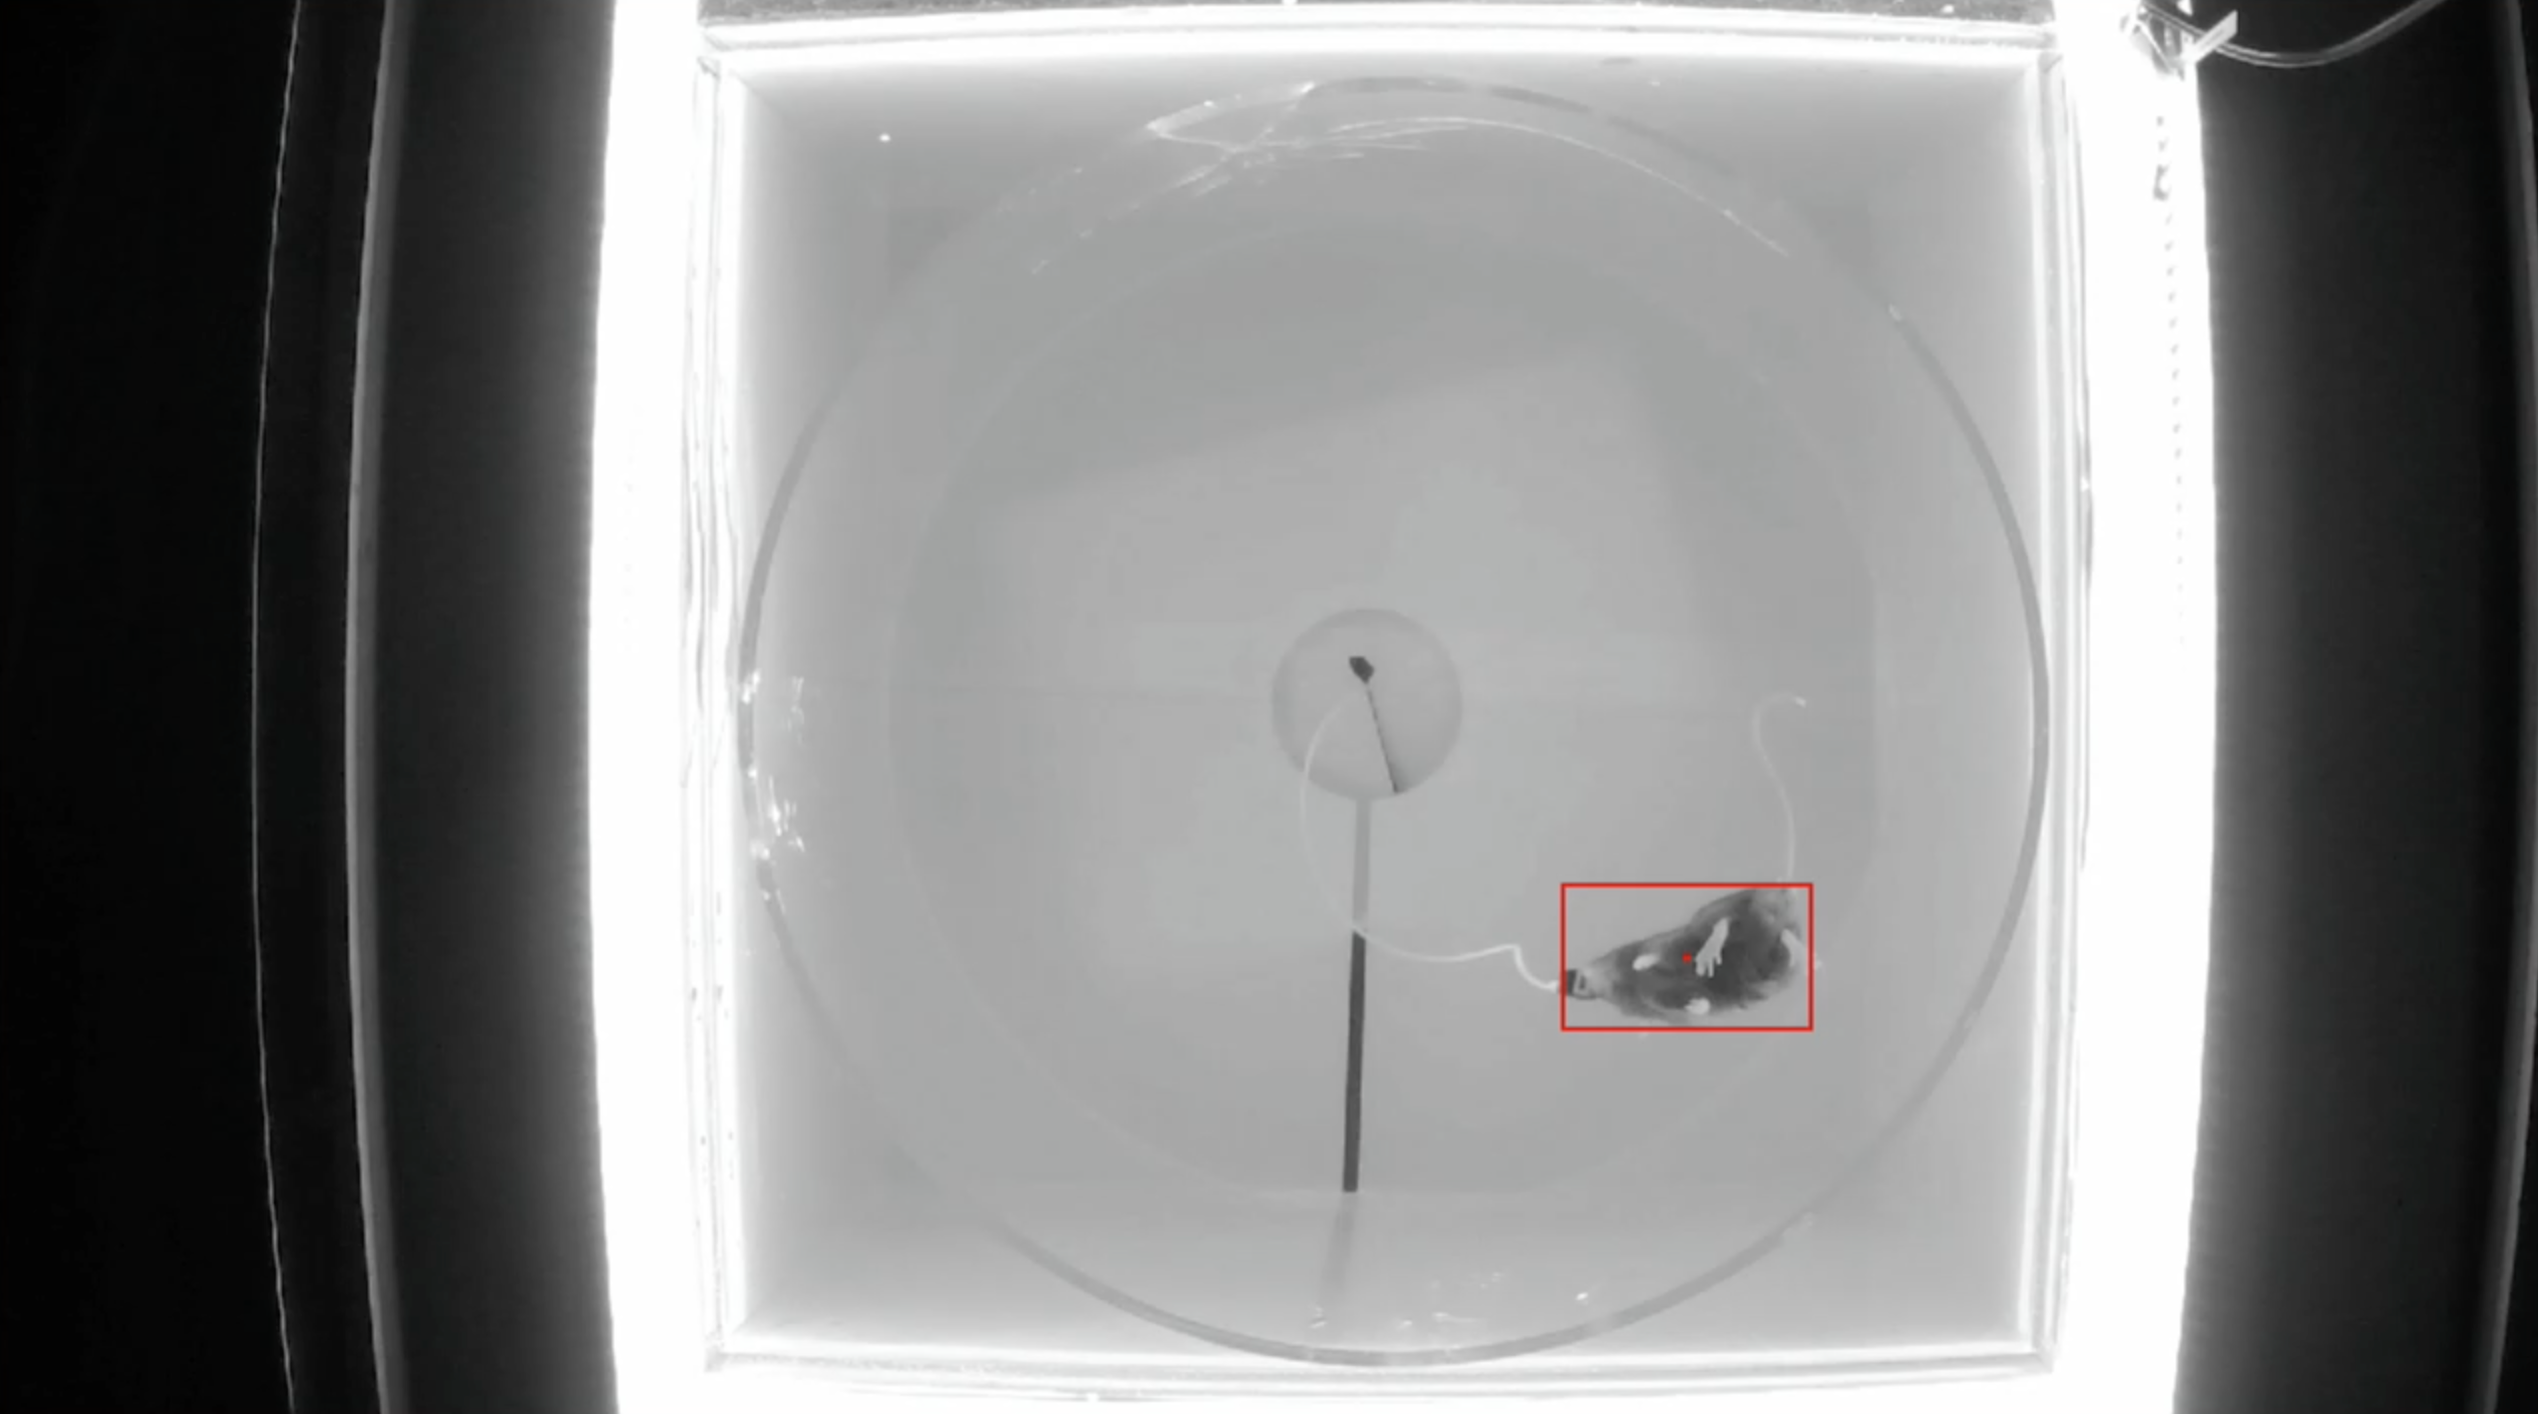
This output is an mp4 movie containing the frames of the input movie, annotated with the tracking result of the model. The results can be annotated on the movie in any one of the following ways, configured through the user parameters:
- Text label
- Bounding box
- Bounding box center
This output is only generated if Generate MP4 is set to true.
Generating this output does not generally affect the performance of the tool, and it can be helpful for quality control of the results.
Previews
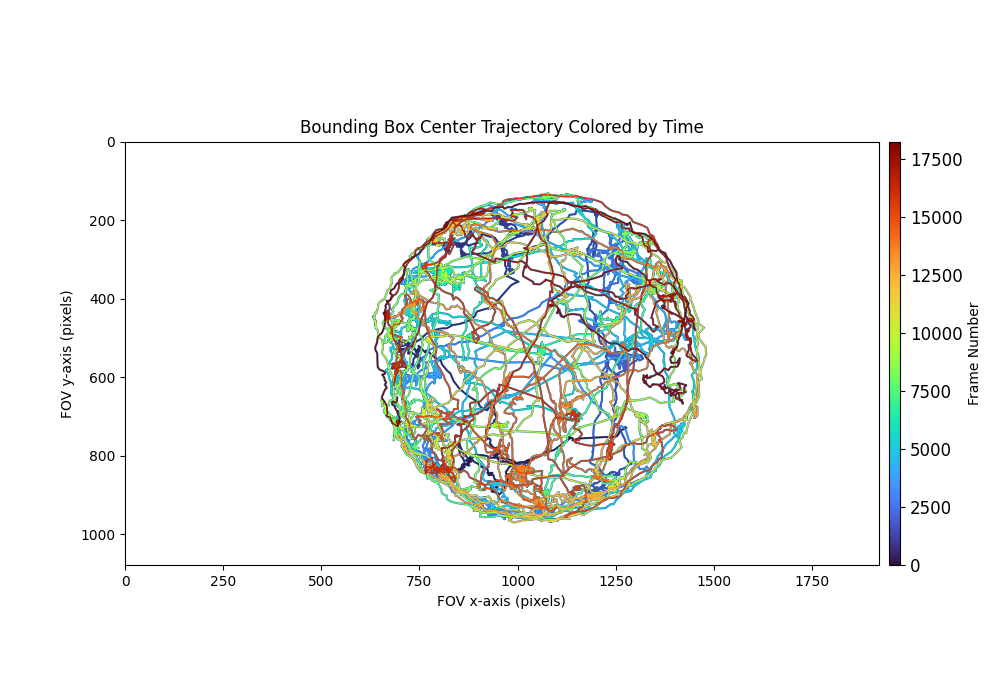
The output annotations file will have the following preview which visualizes the results.
Bounding box center trajectory colored by time:
This preview shows the bounding box center points plotted in the input field of view (FOV). Each point is colored by time, where points occurring earlier in the movie are plotted with cooler colors, and points occurring later in the movie are plotted with warmer colors. This plot can provide insight on which areas of the FOV the animal was in throughout the duration of the recording.
Annotated movie: If an annotated movie is generated, a preview of the movie will be visible.
Next Steps
After running this tool, use the outputs as input to the Compute Locomotion Metrics tool. This tool will compute instantaneous speed and label states of rest and movement from the bounding box center points.
Synchronized Workflow Use Cases
Many use cases are possible when analyzing nVision movies from synchronized calcium-behavior recordings. The following diagram demonstrates the possible workflow use cases for synchronized data using this tool.
All use cases start with a synchronized recording consisting of miniscope (.isxd) and nVision (.isxb) movies.
The miniscope movie is analyzed using one of the cell-identification workflows (i.e., End-to-End CNMF-E, End-to-End PCA-ICA).
The cell-identification workflow will produce a cell set file containing neural-activity from the miniscope movie.
The nVision movie is analyzed using the nVision Animal Tracking Model, producing an experiment annotations file containing the tracking results of the model. These tracking results are passed as input to Compute Locomotion Metrics. This tool will compute instantaneous speed and label states of rest and movement from the bounding box center points of the tracking results.
When running this tool on the tracking results, set Time Column to be Frame Timestamp (s) if Time Ref is start or unix.
If Time Ref is tsc, then set Time Column as Hardware counter (us) and Time Unit as us.
Additionally, set X Column Name to Bounding Box Center X, and Y Column Name to Bounding Box Center Y.
After computing locomotion metrics from the tracking results, the locomotion metrics are almost ready to be compared with the cell set.
However, first, the locomotion metrics must be processed with the cell set through Map Annotations To ISXD Data.
This tool will map every frame in the cell set, with a frame in the locomotion metrics.
The mapping will be done by the tool using the hardware counter timestamps from the cell set file and the locomotion metrics (using the Hardware counter (us) column).
The hardware counter timestamps from both files are synchronized, so they can be directly compared in order to map miniscope frames to behavior frames.
The mapped experiment annotations file will contain one row for every sample in the cell set.
When running this tool on the locomotion metrics, set Time Column to be Frame Timestamp (s), if Time Ref is start or unix.
If Time Ref is tsc, then set Time Column as Hardware counter (us) and Time Unit as us.
Additionally, set State Column to State.
Once the locomotion metrics have been mapped to the cell set, the two files can be used in one of the following Neural Circuit Analyses: Compare Neural Activity Across States, Compare Neural Circuit Correlations Across States. Both of these tools can be used to compare the cell set across the rest and move behavior states from the locomotion metrics.
Finally, the results of neural circuit analysis can be processed further in one of the following Study Statistics: Combine and Compare Population Activity Data, Combine and Compare Correlation Data.