Compare Neural Circuit Correlations Across States
This tool uses 1.0 compute credits per hour.
Overview
Compare Neural Circuit Correlations Across States tool calculates pairwise correlations between cell traces within a cell set for each specified state. It uses activity during the states indicated in the annotation file to find these correlations. The tool then compares the differences in correlations during these states.
Input Data
To run this tool, IDEAS users must have an .isxd cell set
file and a synchronized annotation file.
Valid Inputs
| Source Parameter | File Type | File Format |
|---|---|---|
| Cell Set Files | cell_set | isxd |
| Annotations File | experiment_annotations | parquet |
Generating synchronized annotation files
You can generate the synchronized annotation file by running one of these synchronization tools:
Annotation File Requirement
An annotation file is only required if you want to calculate correlations based on specific states defined within it. If no annotation file or State Names from the tool parameters are provided, correlations will be calculated across the entire recording time.
Parameters
This tool calculates correlations based on the states provided in the State Names parameter.
If State Names are specified, correlations will be calculated for each listed state using the corresponding time segments from the annotation file.
It is important to note that if there are fewer than 10 frames in the recording during a particular state, correlations will not be calculated for that state.
If there are more than 10 frames of data that are not assigned to any specified state, an "other" state will be automatically created, and correlations will also be calculated for this non-state period.
If no State Names are provided (or the annotation file is omitted), correlations will be calculated across the entire recording duration, labeled as "all times".
| Parameter | Required? | Default | Description |
|---|---|---|---|
| Cell Set Files | True | N/A | ISXD cell set file(s) |
| Annotations File | False | N/A | File containing annotations about states, synchronised to ISXD cell set file |
| Column Name | True | state | Column name in annotations file that identifies state |
| State Names | True | N/A | Specify which behavioral states to analyze (comma-separated list). For single state analysis, correlations from that state will be compared with all other time periods. For multiple states, correlations will be compared between the specified states. |
| State Colors | True | N/A | List of matplotlib compatible colors to represent each state |
| Correlation Colors | True | tab:red, tab:blue | List of colors to use for positive and negative correlations, or a colormap |
| Statistic | True | max | Statistic of correlation to compare (max, mean or min) |
| Correlation Threshold for Spatial Map | False | 0.5 | Minimum absolute correlation value to display in the spatial correlation map. Only cell pairs with correlations above this threshold will be shown as connections. |
Algorithm details
Cell Statuses
Individual cell statuses stored in the input cell set are used to determine which cells to include in the analysis. If there are accepted cells, only accepted cells will be used. If there are no accepted cells, only undecided cells will be used. If all cells are rejected, the workflow will raise an error to inform the user.
Outputs
The tool will generate the following outputs:
| File | Format | Description |
|---|---|---|
| Statistic correlations data file | CSV | Contains the specified statistic ('max', 'mean', or 'min') of correlations for each cell across each state (including 'other' or 'all times' if applicable). Cells as rows, states as columns. |
| Average correlations data file | CSV | Contains the average positive and average negative correlation value for each state. |
| Raw correlations data file | HDF5 | A HDF5 file containing the raw correlation matrix for each state. |
| Raw correlations data file | ZIP | A ZIP archive containing detailed raw correlation data in CSV format. Includes: - correlation_matrix_[state].csv: Full raw correlation matrix for each state. - correlation_matrix_[state]_triu.csv: Upper triangle of the correlation matrix with cell name pairs. This file also contains cell centroid coordinates (x1, y1, x2, y2) and the Euclidean distance between cell pairs. - README.txt: Explains the contents of the zip file. |
Previews
The tool will also generate previews of the output data, which are described in the following sections.
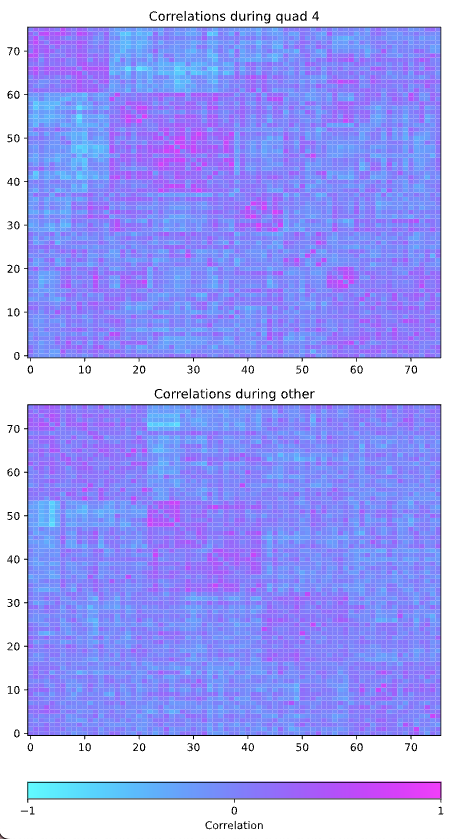
Correlation Heat Maps
This preview will display correlation heat maps for each state specified in the annotation file and a heat map for all data not in any specified state. The data points are reorganized using hierarchical clustering so that groups of highly correlated variables are next to each other. The diagonal entries in the correlation matrices are set to zero.
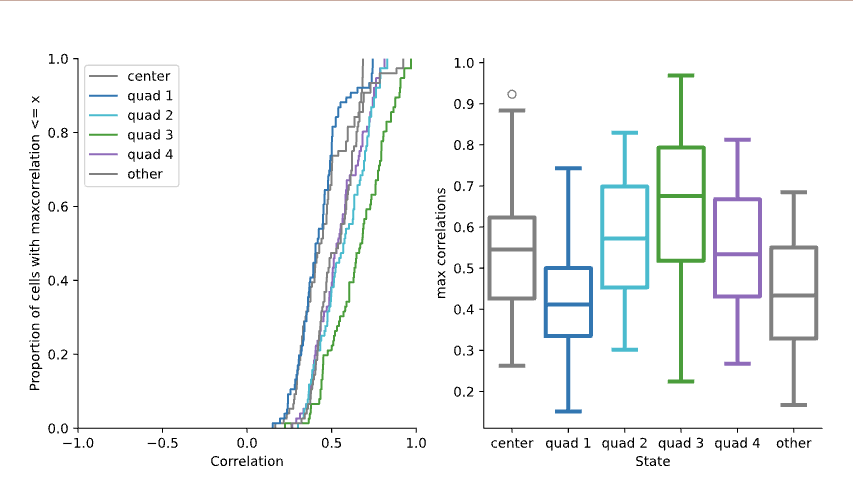
Statistic Distribution Comparison
This preview displays the distribution of the chosen correlation statistic (max, mean, or min) across different states. It consists of two plots:
- Cumulative Distribution Function (CDF): Shows the CDF of the correlation statistic for each state, allowing comparison of the overall distribution shapes.
- Box Plot: Provides a comparison of the central tendency and spread of the correlation statistic for each state using box plots (only shown if more than one state is analyzed).
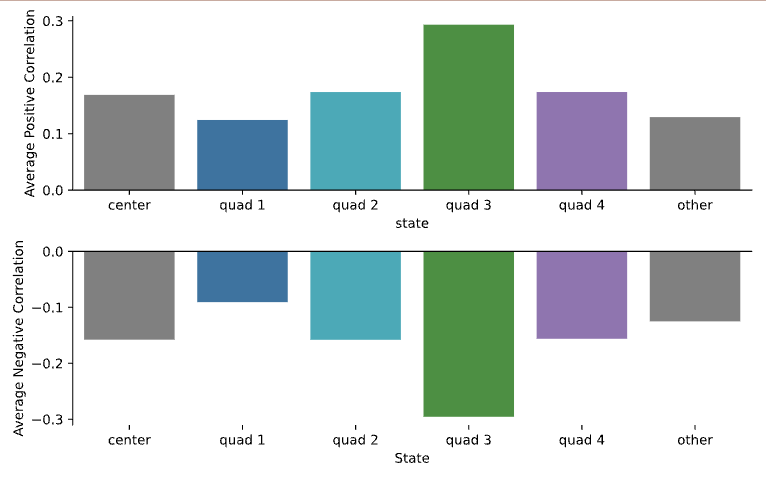
Average Correlations
This preview shows bar plots comparing the average positive and average negative correlations calculated for each state.