Combine and Compare Peri-Event Data Across Epochs
This tool uses 1.0 compute credits per hour.
Overview
This tool is used to combine the peri-event data produced by the Compare Peri-Event Activity Across Epochs tool from multiple recordings and statistically compare two groups to determine if there is a difference in the post-pre activity across epochs.
Inputs
Files
For each input group, the peri-event traces and statistics files are required for each subject. Those files are generated by the Compare Peri-Event Activity Across Epochs tool.
| Source Parameter | File Type | File Format |
|---|---|---|
| Peri-Event Traces Files (Group 1) | event_aligned_neural_data | csv |
| Peri-Event Statistics Files (Group 1) | statistics | csv |
| Peri-Event Traces Files (Group 2) | event_aligned_neural_data | csv |
| Peri-Event Statistics Files (Group 2) | statistics | csv |
Parameters
| Parameter | Required? | Default | Description |
|---|---|---|---|
| Peri-Event Traces Files (Group 1) | True | N/A | Select peri-event traces from the first group to use for analysis |
| Peri-Event Statistics Files (Group 1) | True | N/A | Select peri-event statistics from the first group to use for analysis |
| Name (Group 1) | True | N/A | Name of the first group |
| Peri-Event Traces Files (Group 2) | False | N/A | Select peri-event traces from the second group to use for analysis |
| Peri-Event Statistics Files (Group 2) | False | N/A | Select peri-event statistics from the second group to use for analysis |
| Name (Group 2) | False | N/A | Name of the second group |
| Epoch Names | True | N/A | Comma-separated list of epoch names (e.g. Epoch 1, Epoch 2, Epoch 3) |
| Epoch Colors | True | N/A | Comma-separated list of matplotlib compatible colors to represent each epoch (e.g. grey, blue, cyan) |
| Comparison Type | True | two_tailed | Type of statistical test to perform |
| Data Pairing | False | N/A | Indicates whether observations should be paired for statistical comparison |
| Parametric | False | N/A | Indicates whether to perform a parametric test. If set to 'auto', a parametric test will be used if the data follows a normal distribution and there are at least 8 observations. Otherwise, a non-parametric test will be used. |
| Significance Threshold | True | 0.05 | p-value threshold for classifying neurons as up- or down-modulated |
| Average Method | True | neurons | Specifies how to average the data in each input group. If 'By Neurons' is selected, the neurons from all recordings in the group will be pooled together and averaged to obtain the group average. If 'By Recordings' is selected, the data contained in each recording will be averaged independently, then the recordings will be averaged together to obtain the group average. |
| Tolerance | True | 0.01 | Maximum time shift in seconds between the time windows of the input traces files |
| Population activity (y-axis range) | False | auto | y-axis range (z-score) applied to the event-aligned population activity plots specified as 'min,max' (e.g. -1,1) or 'auto' |
| Activity heatmap (colormap range) | False | auto | colormap range (z-score) applied to the activity heatmaps specified as 'min,max' (e.g. -1,1) or 'auto' |
| Activity by modulation group (y-axis range) | False | auto | y-axis range (z-score) applied to the event-aligned activity by modulation plots specified as 'min,max' (e.g. -1,1) or 'auto' |
| Group colors | False | #1f77b4, #ff7f0e | Colors that represent group 1 and 2, respectively. (must be matplotlib compatible) |
| Modulation colors | False | green,blue,black | Comma-separated list of matplotlib compatible colors representing the up-, down- and non-modulated neurons, respectively |
| Activity heatmap colormap | False | coolwarm | Colormap applied to the activity heatmaps (must be matplotlib compatible) |
Algorithm Description
The workflow is summarized using a flowchart below.
The workflow begins by combining the data in the first input group. If no data is selected for the second input group, the workflow terminates upon combining the data from the first group. If data is selected for the second group, that data will be combined independently from the first group. Finally, the two groups are compared to determine if there is statistically significant difference between them.
Combination
The combination step is performed independently for each input group. The process starts with the alignment of time windows across the input files. If the difference between the time windows is within the specified tolerance, the algorithm will align the time points across the input files and trim off excess time points. The data from all recordings in the group is then aggregated, creating a population of cells. Individual cells are classified as up-, down-, or non-modulated based on the significance threshold parameter. The fraction of up-, down-, and non-modulated neurons across the aggregated population of cells is computed. The event-aligned population activity is obtained by averaging the neural activity at each time point. When averaging across neurons, neurons from all recordings in the group are pooled together and averaged to obtain the group average. When averaging across recordings, the data is first averaged across neurons for each recording, yielding a single average trace per recording. The recording traces are then averaged together to obtain the group average. Likewise, the event-aligned sub-population activity is obtained for each modulation category (up-modulated, down-modulated, non-modulated) by averaging the neural activity of the corresponding cells.
Comparison
The mean post-pre activity is computed for each recording and each epoch. A t-test is then performed to compare the means of the two groups for each epoch. The t-statistic and corresponding p-value is reported for each statistical test. We specifically test for the null hypothesis that the two groups have identical average values. The alternative hypothesis tested is determined by the comparison type parameter as described in the table below.
| Comparison Type | Hypothesis Tested |
|---|---|
| One-Tailed (Less) | mean post-pre activity in the first group is less than the second group |
| One-Tailed (Greater) | mean post-pre activity in the first group is greater than the second group |
| Two-Tailed (Unequal) | mean post-pre activity in the first group is different from the second group, i.e. the post-pre activity in the the first group is either less than or greater than the second group |
The mean post-pre activity in each epoch is compared between the two groups and the results of the pairwise comparisons included in the output. When comparing multiple epochs, an Analysis of Variance (ANOVA) is performed and the corresponding results included in the output.
Outputs
Combined Data
The data within each input group is combined and the files listed below produced for each group.
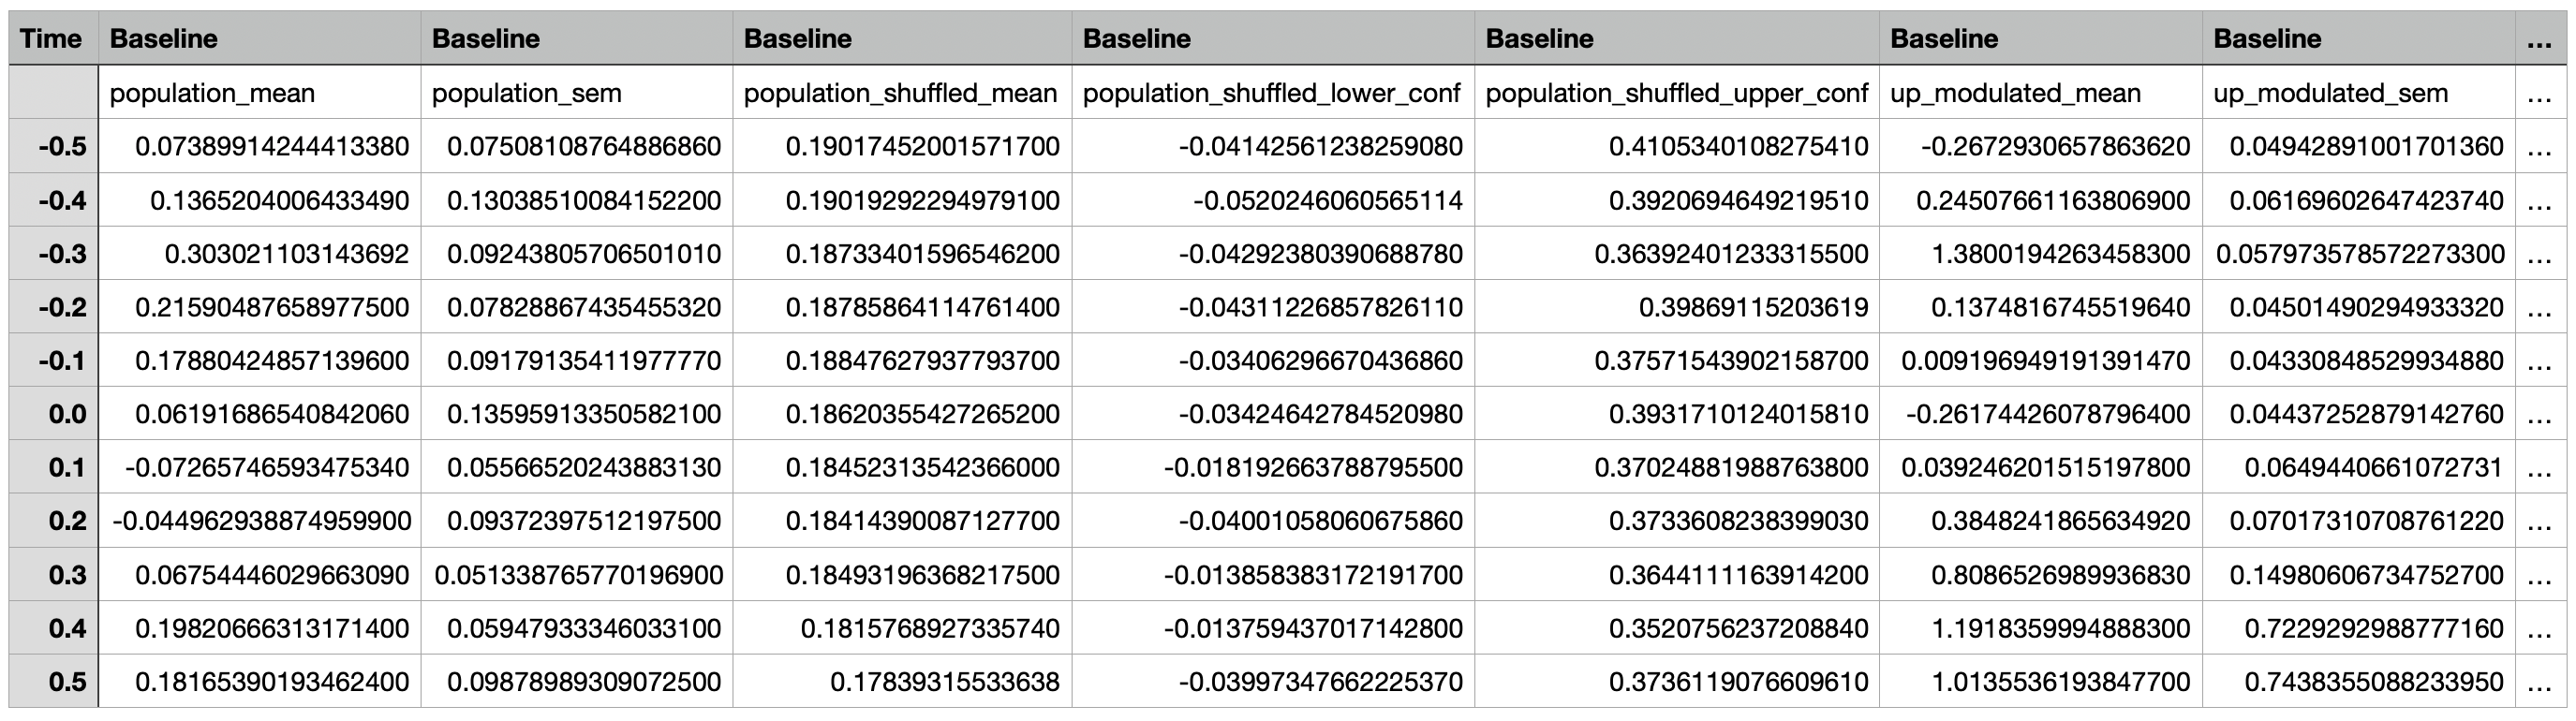
Event-Aligned Data
A csv file containing the event-aligned traces for the population, subpopulations (up modulated, down modulated, non modulated), and individual cells for each epoch.
The first two rows consist of column headers. With the exception of the Time column, the first row contains the epoch names
while the second row contains the name of the traces.
The Time column represents the time points relative to the event time in seconds, with 0 representing the event time,
negative numbers representing time points before the event, and positive numbers representing timepoints after the event.
The other columns contain the mean neural activity around an event and the corresponding standard error of the mean
for individual cells, subpopulations (up modulated, down modulated, non modulated), and the overall population.
The event-aligned data from all recordings is combined and used to generate the same figures as the Compare Peri-Event Activity Across Epochs tool.
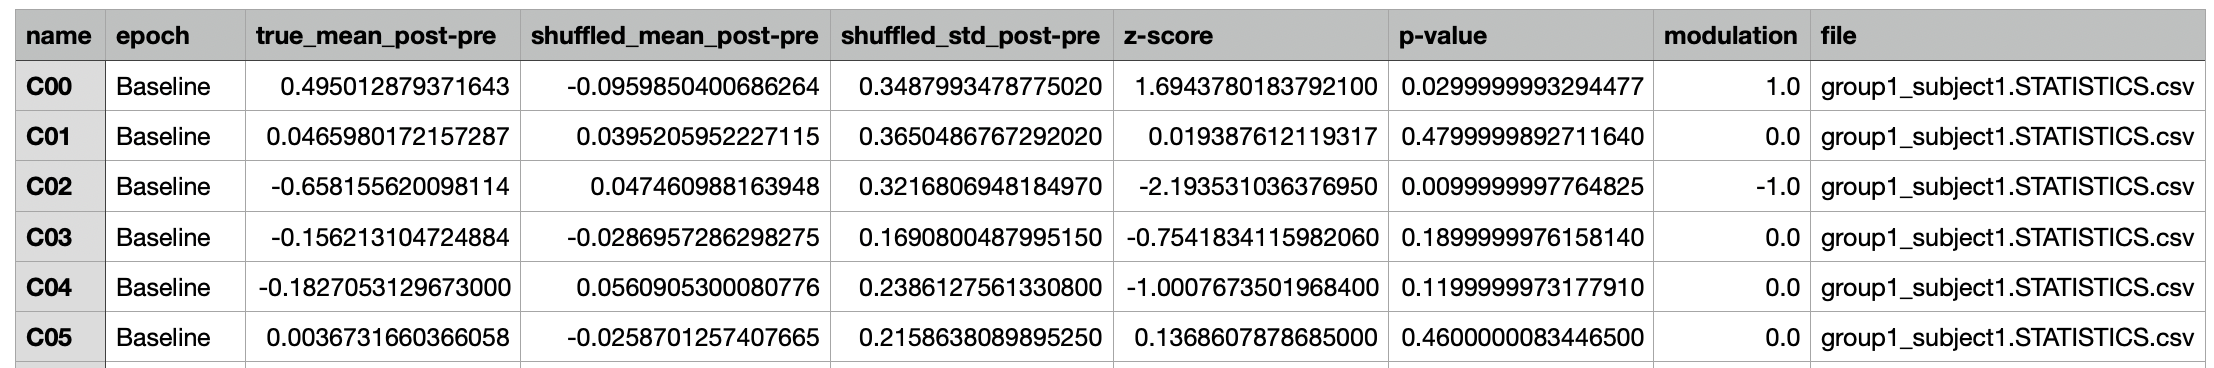
Event-Aligned Statistics
A csv file containing the peri-event change in activity (post-pre), modulation, and the corresponding statistical metrics
for the population, subpopulations (up modulated, down modulated, non modulated), and individual cells for each epoch.
Each row contains data for a given cell, subpopulation, or population within the epoch specified under the epoch column.
The columns contain the measurements and statistical metrics computed.
The statistics data from all recordings is combined and used to generate the same figures as the Compare Peri-Event Activity Across Epochs tool, and one additional pie chart per epoch depicting the fraction of neurons in each sub-population (up-, down-, and non-modulated neurons).
Epoch Pairwise Comparisons
A csv file containing the differences between each pair of epochs and the corresponding statistical metrics.
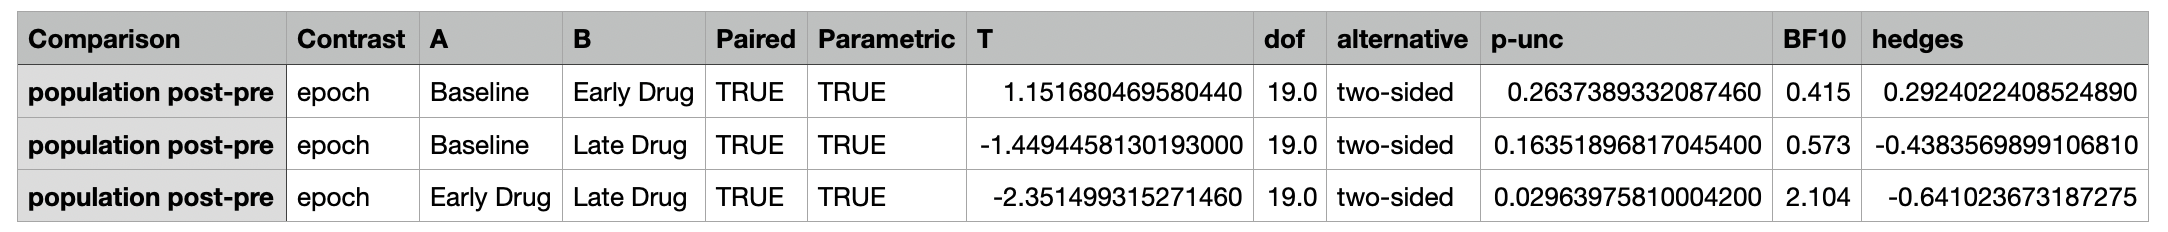
The individual columns are described below:
| Column Name | Description |
|---|---|
| Comparison | The metric being compared |
| Contrast | The type of contrast being made |
| Epoch | The epoch being compared |
| A | The first group being compared |
| B | The second group being compared |
| Paired | Whether the comparison is paired |
| Parametric | Whether the comparison is parametric |
| T | The t-statistic |
| dof | The degrees of freedom |
| alternative | The alternative hypothesis |
| p-unc | The uncorrected p-value |
| BF10 | Bayes Factor of the alternative hypothesis |
| hedges | Hedges g effect size |
Group Comparison Data
Group ANOVA Comparisons
A csv file containing the ANOVA results.
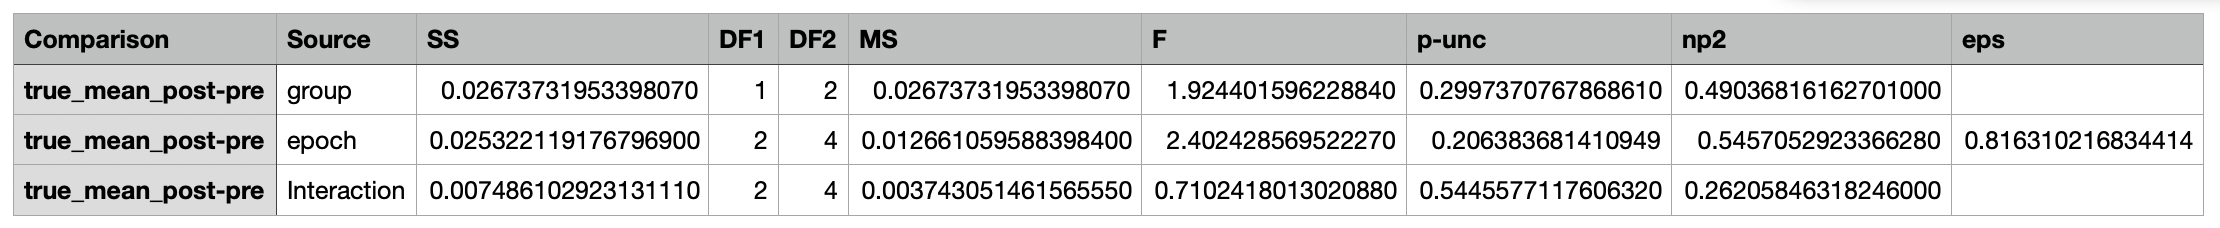
The individual columns are described below:
| Column Name | Description |
|---|---|
| Comparison | The metric being compared |
| Source | The source of the variance (Group, Epoch, Interaction) |
| SS | The sum of squares |
| DF1 | The degrees of freedom for each source of variation. |
| DF2 | The degrees of freedom associated with the residual error (i.e., the variance that is not explained by the model) |
| MS | The mean square (SS / DF1) |
| F | The F-statistic |
| p-unc | The uncorrected p-value |
| np2 | The partial eta-squared effect size |
| eps | The epsilon value, which is a measure of sphericity |
Group Pairwise Comparisons
A csv file containing the group pairwise comparison results.
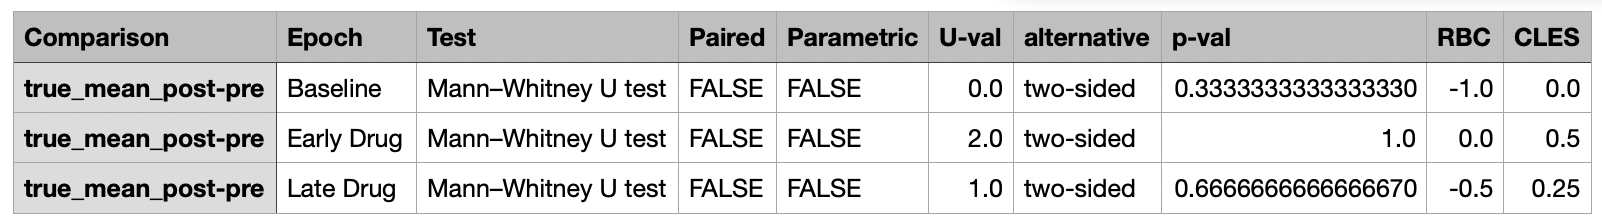
The individual columns are described below and may vary based on the statistical test performed:
| Column Name | Description |
|---|---|
| Comparison | The metric being compared (Trace, Event, Positive Correlation, Negative Correlation) |
| Epoch | The epoch being compared |
| Test | The statistical test performed |
| Paired | Whether the comparison is paired |
| Parametric | Whether the comparison is parametric |
| T | The t-statistic (included with parametric tests only) |
| dof | The degrees of freedom (included with parametric tests only) |
| U-val | The U-value (included with unpaired non-parametric tests only) |
| W-val | The W-value (included with paired non-parametric tests only) |
| alternative | The alternative hypothesis |
| p-val | The p-value |
| CI95% | Confidence intervals of the difference in means (included with parametric tests only) |
| cohen-d | Cohen d effect size (included with parametric tests only) |
| BF10 | Bayes Factor of the alternative hypothesis (included with parametric tests only) |
| power | achieved power of the test ( = 1 - type II error) (included with parametric tests only) |
| RBC | Rank-biserial correlation (included with non-parametric tests only) |
| CLES | Common language effect size (included with non-parametric tests only) |
Group Comparison Figure

This figure compares the post-pre activity between the two groups for each epoch. The boxes show the quartiles of the data while the whiskers extend to show the remainder of the distribution. Points that are determined to be outliers appear as individual dots located beyond the whiskers. The boxplot function from the seaborn package is used to generate the figure.