Manually Filter Cells
This tool uses 0.5 compute credits per hour.
The Manually filter cells tool allows users to manually set the accepted or rejected status of cells in a dataset. This tool utilizes the quality control report and optionally a corresponding event set file to display the cells in a dataset and their associated quality control metrics. Users can then manually set the status of each cell to accepted, rejected, or undecided. The tool outputs a new cell set file and quality control report with the updated statuses for each cell.
Inputs
| Parameter | Required? | Default | Description |
|---|---|---|---|
| Input Cell Sets | True | N/A | paths to the input cell sets |
| Input QC Reports | True | N/A | paths to the QC reports |
| Input Event Sets | False | N/A | paths to the input event sets |
| New Cell Statuses | True | N/A | Select the new status for each cell |
File Inputs
| Source Parameter | File Type | File Format |
|---|---|---|
| Input Cell Sets | cell_set | isxd |
| Input QC Reports | calcium_image_qc_data, calcium_image_qc_report | html, html |
| Input Event Sets | neural_events | isxd |
Description
Once the cell set and quality control report are loaded, the user can open the cell status GUI element using the New Cell Statuses column.
Cell Status GUI
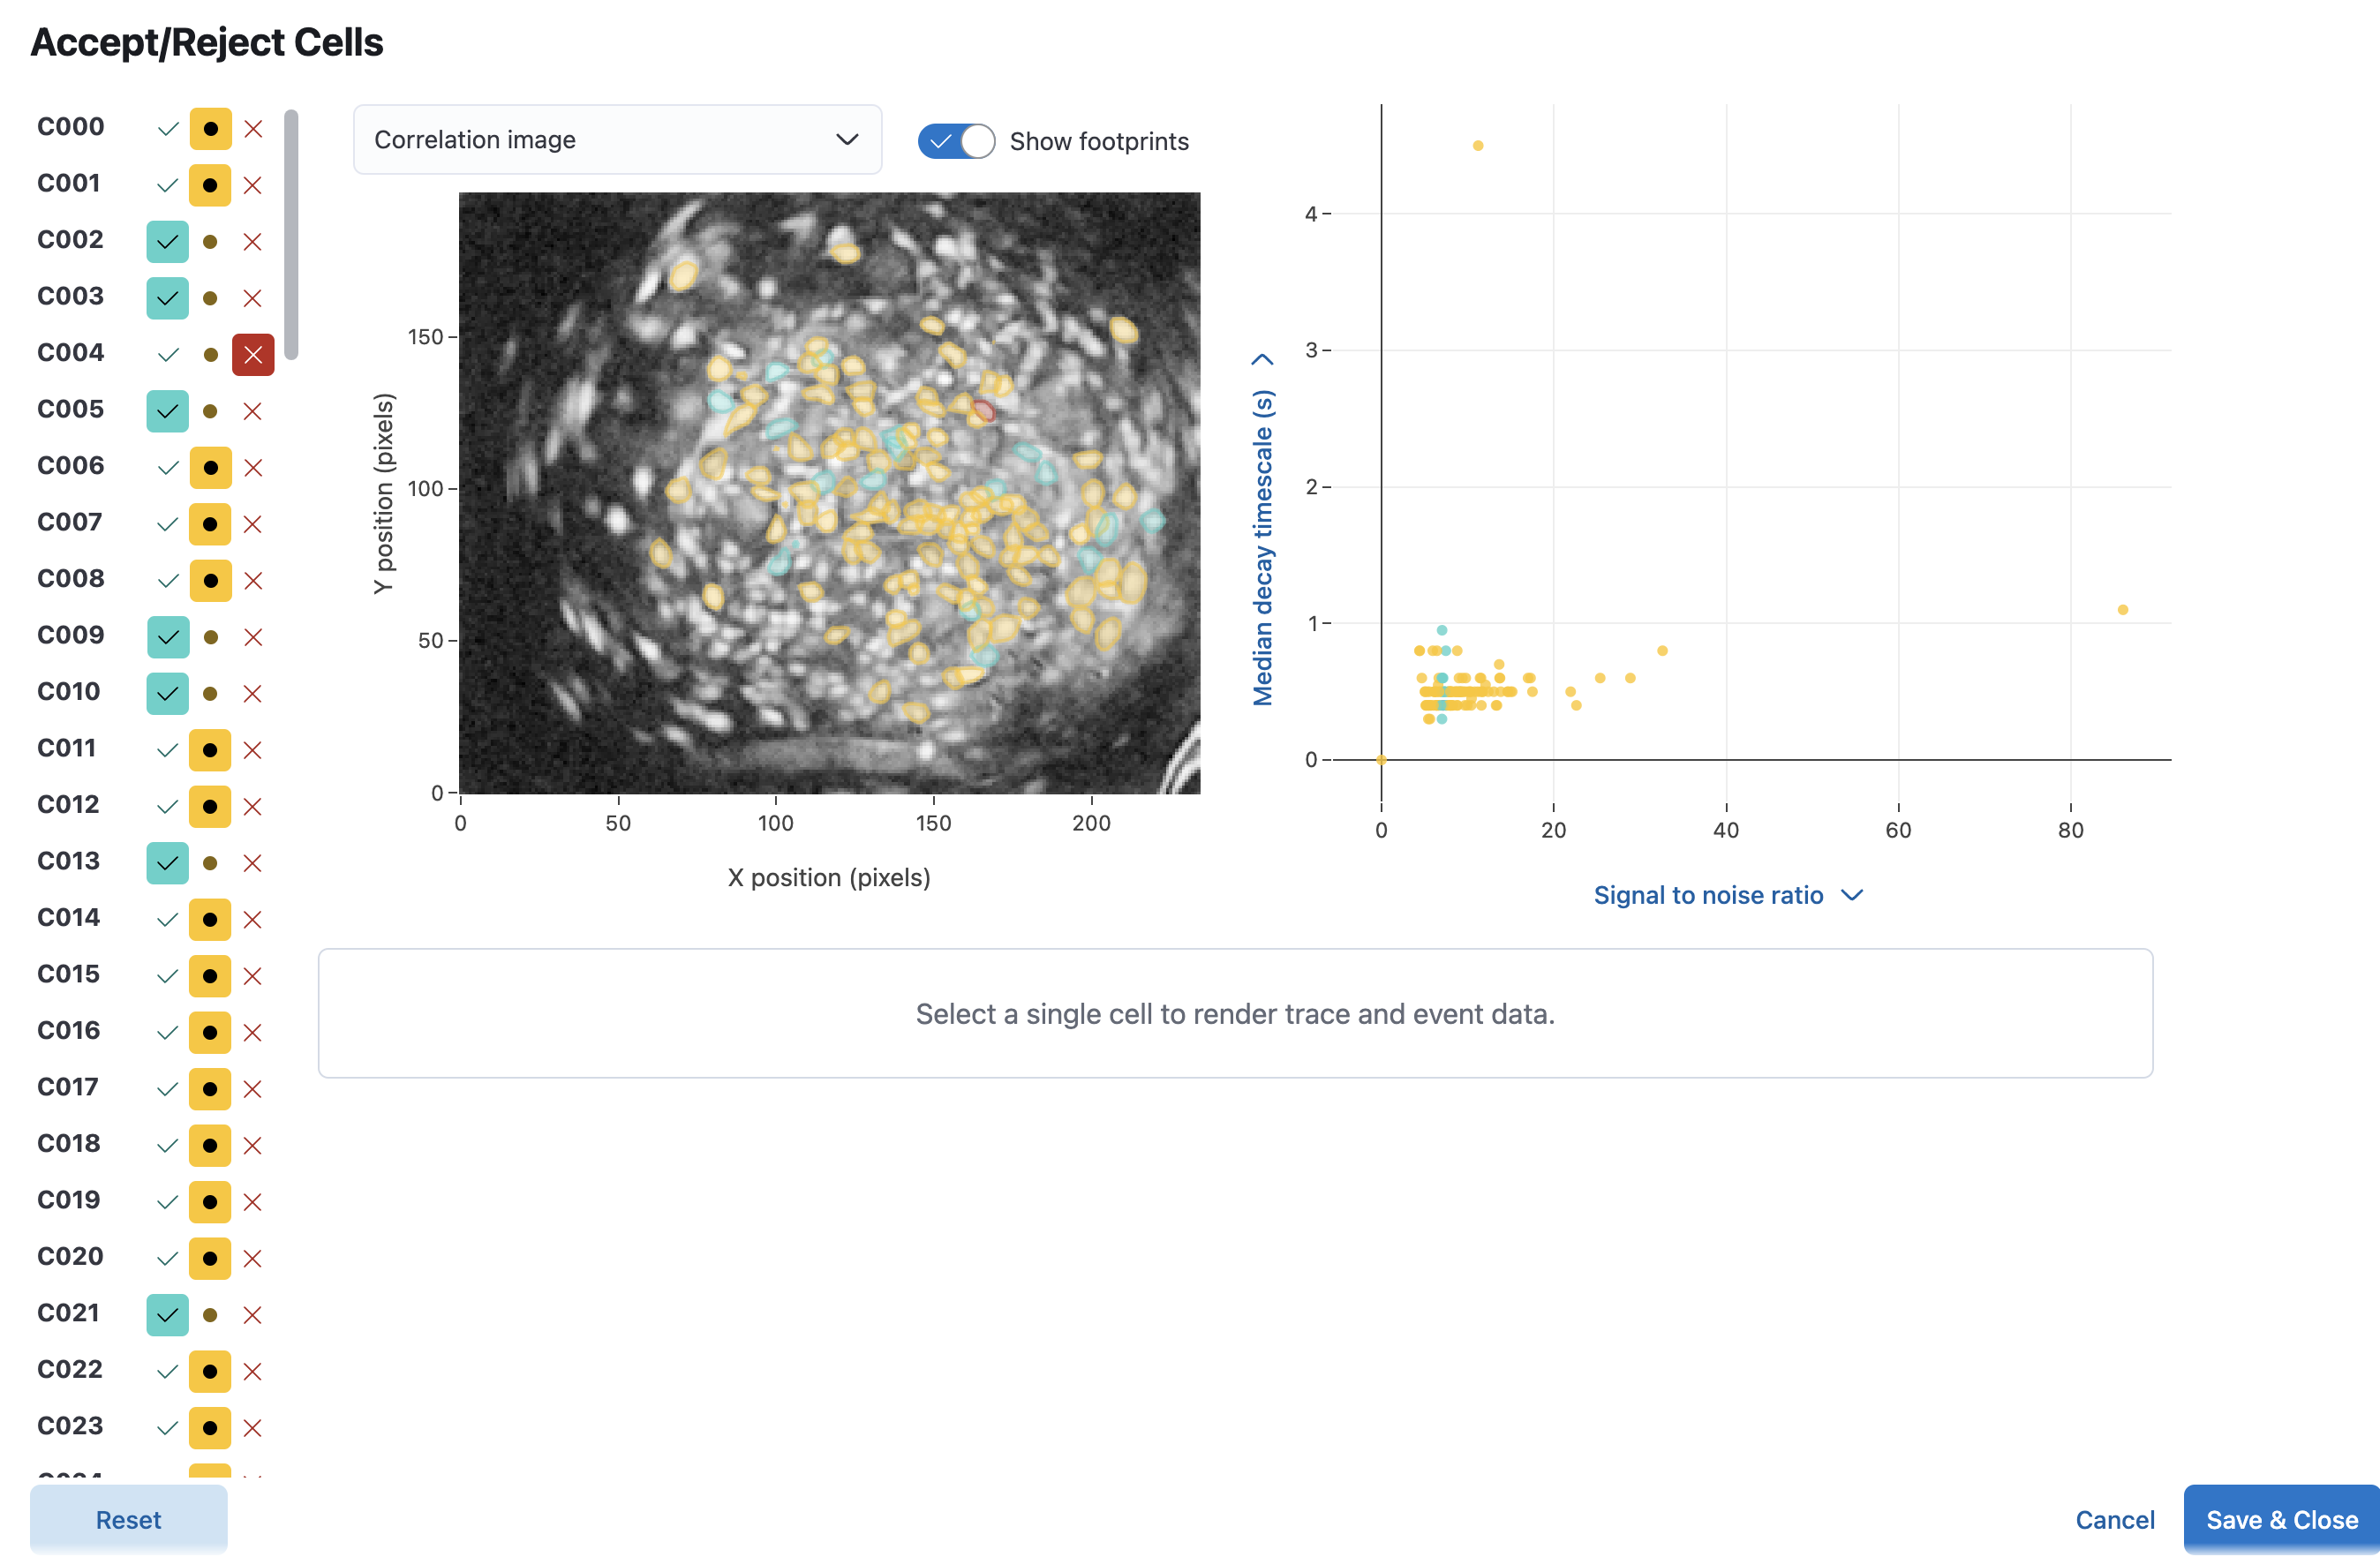
Cell Statuses
On the left hand side is a column showing the current status of each cell. The status for each cell can be changed by clicking the green check mark (accept), the black dot (undecided), or the red X (reject). The status of each cell is saved automatically when changed. You can also view the trace (and events if provided) for each cell by clicking on the cell ID. The trace will be displayed along the bottom of the GUI. At the bottom of the column is a reset button that will reset the status of all cells to the state they were in when the GUI was opened.
Cell Map
In the center of the GUI is a map of the cells in the dataset. The edge of the footprints for each cell is colored according to the status of the cell. The color key is the same as the highlight color for each cell in the table. Cyan cells are accepted, red cells are rejected, and yellow cells are undecided. Selecting a cell in the map will highlight the corresponding cell row in the column on the left.
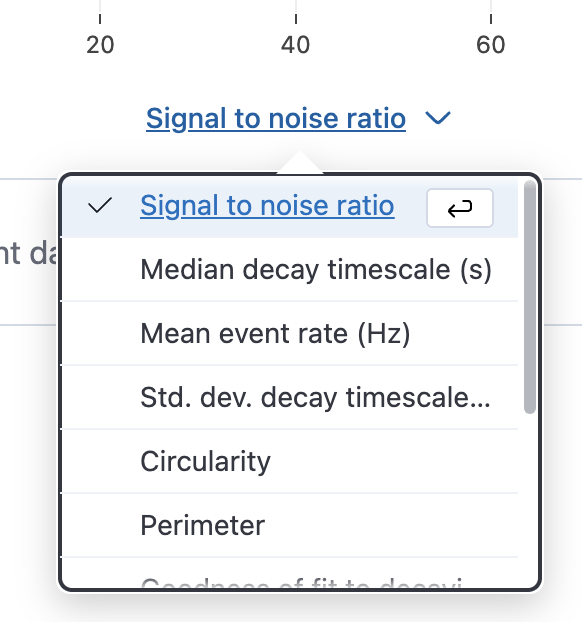
Cell metrics plot
On the far left of the GUI is a scatter plot showing the relationship between two metrics. You can select which metrics to plot using the dropdown menus on the left and bottom of the plot.
If you hover over the scatterplot, you can see the controls on the plot.
| Icon | Function |
|---|---|
| Camera | Take a screenshot of the plot and save it as a .png file. |
| Magnifying Glass | Zoom in on a specific region of the plot by clicking and dragging. |
| Up/Down Arrow | Pan around the plot by clicking and dragging. |
| Box Select | Select a region of the plot to highlight cells in the table within the region. |
| Lasso Select | Select a region of the plot by drawing a freehand shape. |
| Plus sign | Zoom in on the plot. |
| Minus sign | Zoom out on the plot. |
| Diagonal Arrow | Automatically fit the plot to the window. |
| Home | Reset the plot to its original state. |
Save
Once you have finished setting the status of each cell, you can save the updated cell set and quality control report using the Save & Close button. The updated cell set and quality control report will be saved to the same directory as the original files. You can also return to the original cell set and quality control report by clicking the Cancel button.
Run the Tool
The tool creates an output cell set with the same traces and footprints as the input cell set, and sets the cell statuses using the input cell statuses, manually defined in the Cell Status GUI. An output quality control report is also generated with updated cell statuses.
Outputs
The tool will output a new cell set file and quality control report with the updated statuses for each cell.