Combine and Compare Peri-Event Analysis Data
This tool uses 1.0 compute credits per hour.
Overview
This tool is used to combine peri-event analysis data from multiple recordings and perform a statistical comparison between two groups to determine if there is a difference in the fractions of up- or down-modulated neurons.
Parameters
| Parameter | Required? | Default | Description |
|---|---|---|---|
| Peri-Event Traces Files | True | N/A | Select peri-event traces from the first group to use for analysis |
| Peri-Event Statistics Files | True | N/A | Select peri-event statistics from the first group to use for analysis |
| Name | True | group1 | Name of the first group |
| Peri-Event Traces Files | False | N/A | Select peri-event traces from the second group to use for analysis |
| Peri-Event Statistics Files | False | N/A | Select peri-event statistics from the second group to use for analysis |
| Name | False | N/A | Name of the second group |
| Comparison Type | False | N/A | Type of statistical test to perform |
| Data Pairing | False | N/A | Indicates whether observations should be paired for statistical comparison |
| Significance Threshold | False | N/A | p-value threshold for classifying neurons as up- or down-modulated |
| Average Method | True | neurons | Specifies how to average the data |
Valid Inputs
| Source Parameter | File Type | File Format |
|---|---|---|
| Peri-Event Traces Files | neural_traces | csv |
| Peri-Event Statistics Files | statistics | csv |
| Peri-Event Traces Files | neural_traces | csv |
| Peri-Event Statistics Files | statistics | csv |
Algorithm Description
The workflow is summarized using a flowchart below.
The workflow begins by combining the data in the first input group. If no data is selected for the second input group, the workflow terminates upon combining the data from the first group. If data is selected for the second group, that data will be combined independently of the first group. Finally, the two groups are compared to determine if there is statistically significant difference between them.
Combination
The combination step is performed independently for each input group. The process starts with the aggregation of the data from all recordings in the group, creating a population of cells. Individual cells are classified as up-, down-, or non-modulated based on the significance threshold parameter. The fraction of up-, down-, and non-modulated neurons across the aggregated population of cells is computed. The event-aligned population activity is obtained by averaging the neural activity at each time point. The event-aligned sub-population activity is obtained for each modulation category (up-modulated, down-modulated, non-modulated) by averaging the neural activity of the corresponding cells.
Comparison
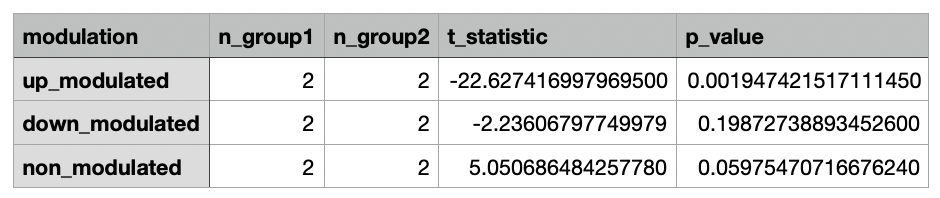
The fraction of up-, down-, and non-modulated neurons is computed for each recording. A t-test is then performed to compare the means of the two groups for each modulation category (up-modulated, down-modulated, non-modulated). The t-statistic and corresponding p-value is reported for each statistical test.
Output Figures
Combination Figures
Comparison Figures
Legend
| Panel | Description |
|---|---|
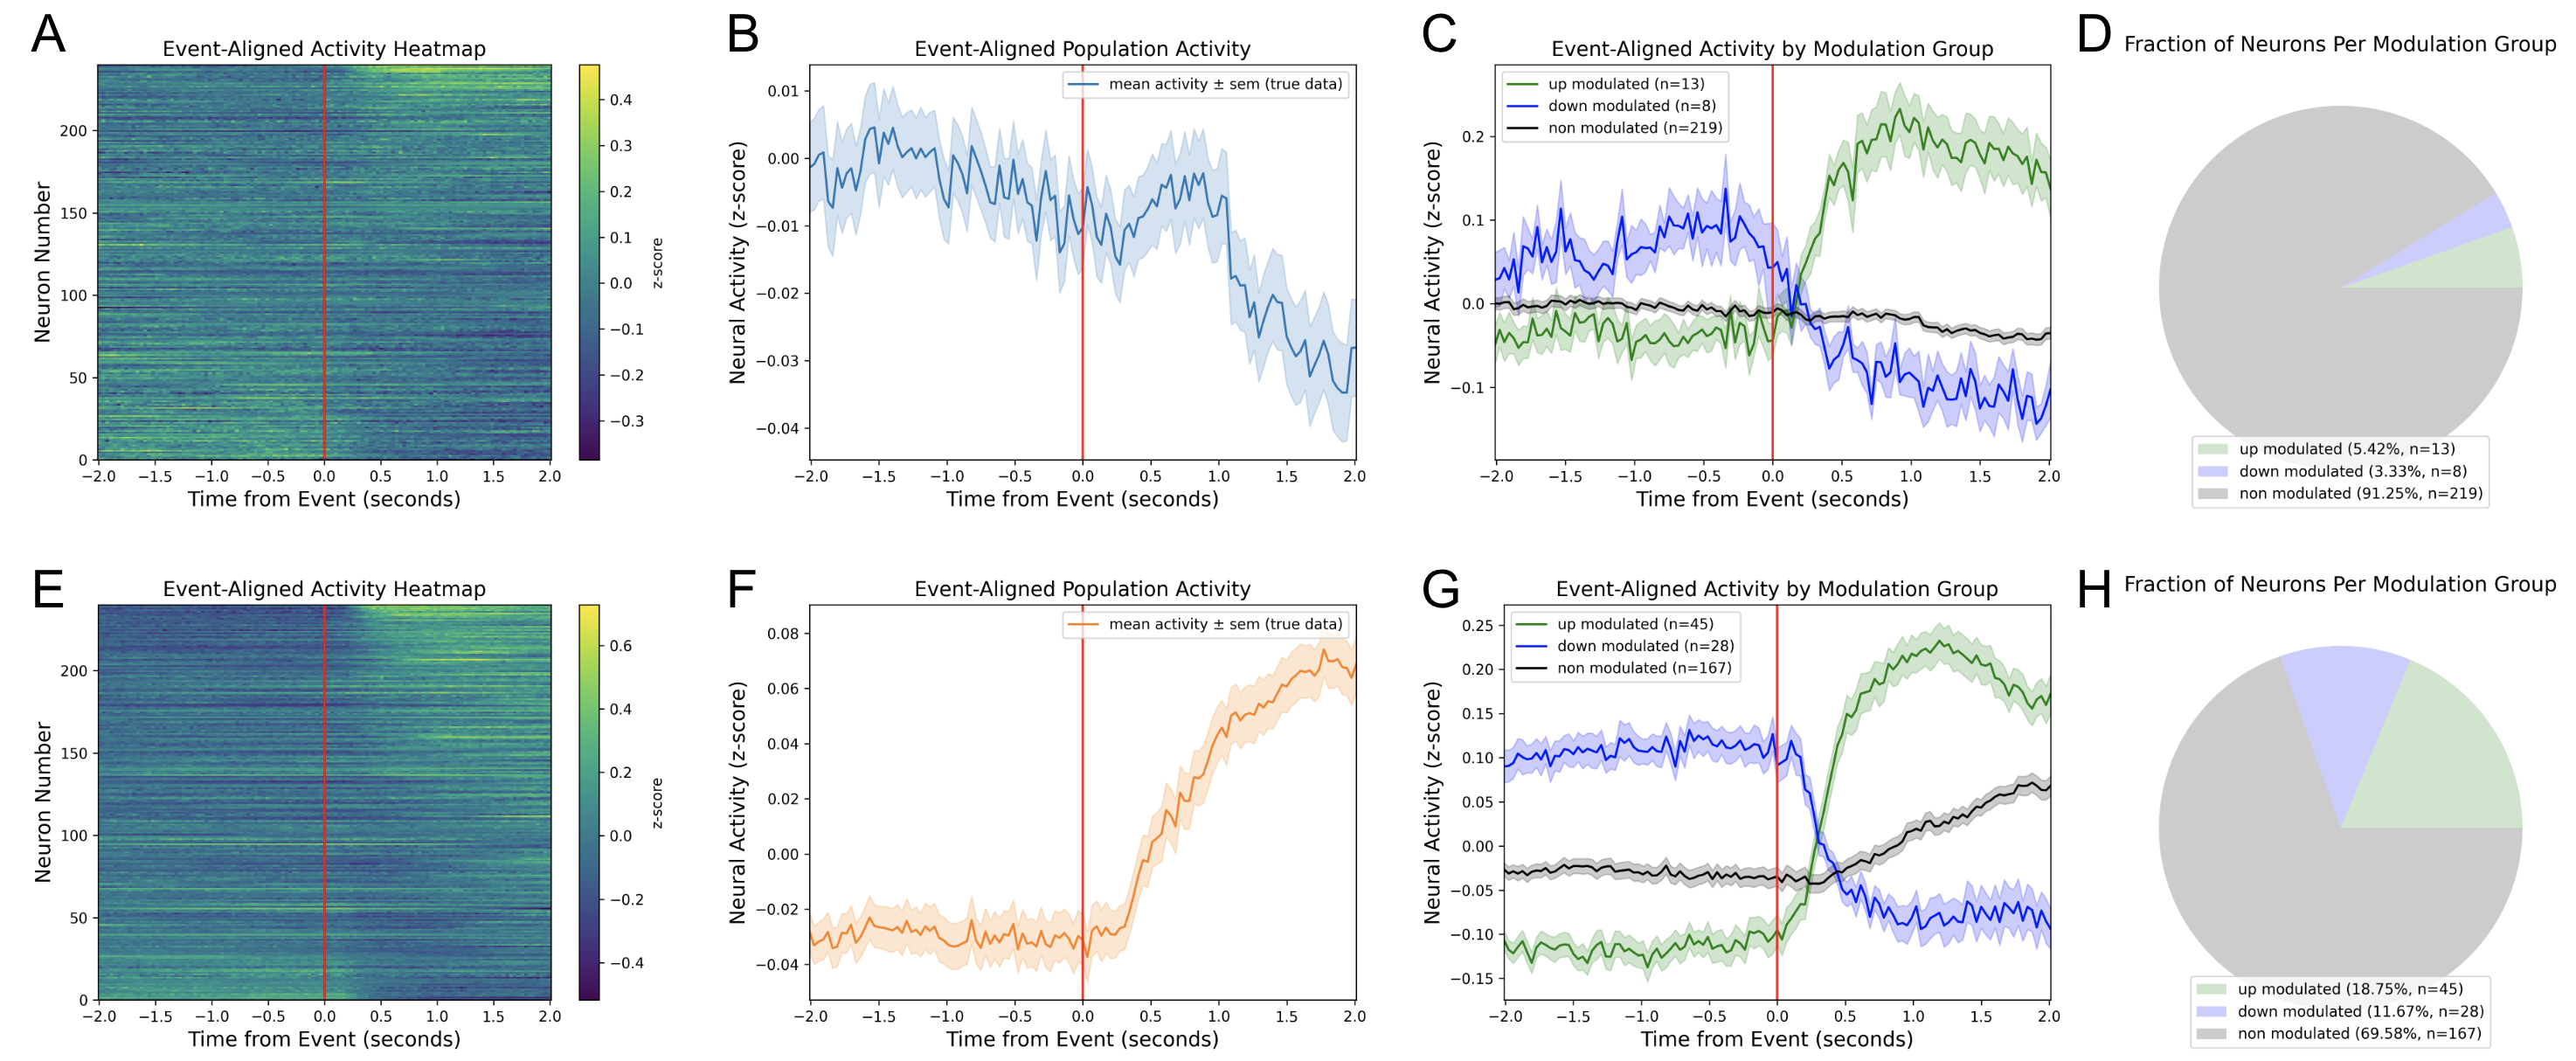
| A, E | Event-aligned activity heatmaps of the first and second groups, respectively. |
| B, F | Event-aligned population activity of the first and second groups, respectively. |
| C, G | Event-aligned sub-population activity of the first and second groups, respectively. |
| D, H | Pie chart showing the fraction of up-, down-, and non-modulated neurons in the first and second groups, respectively. |
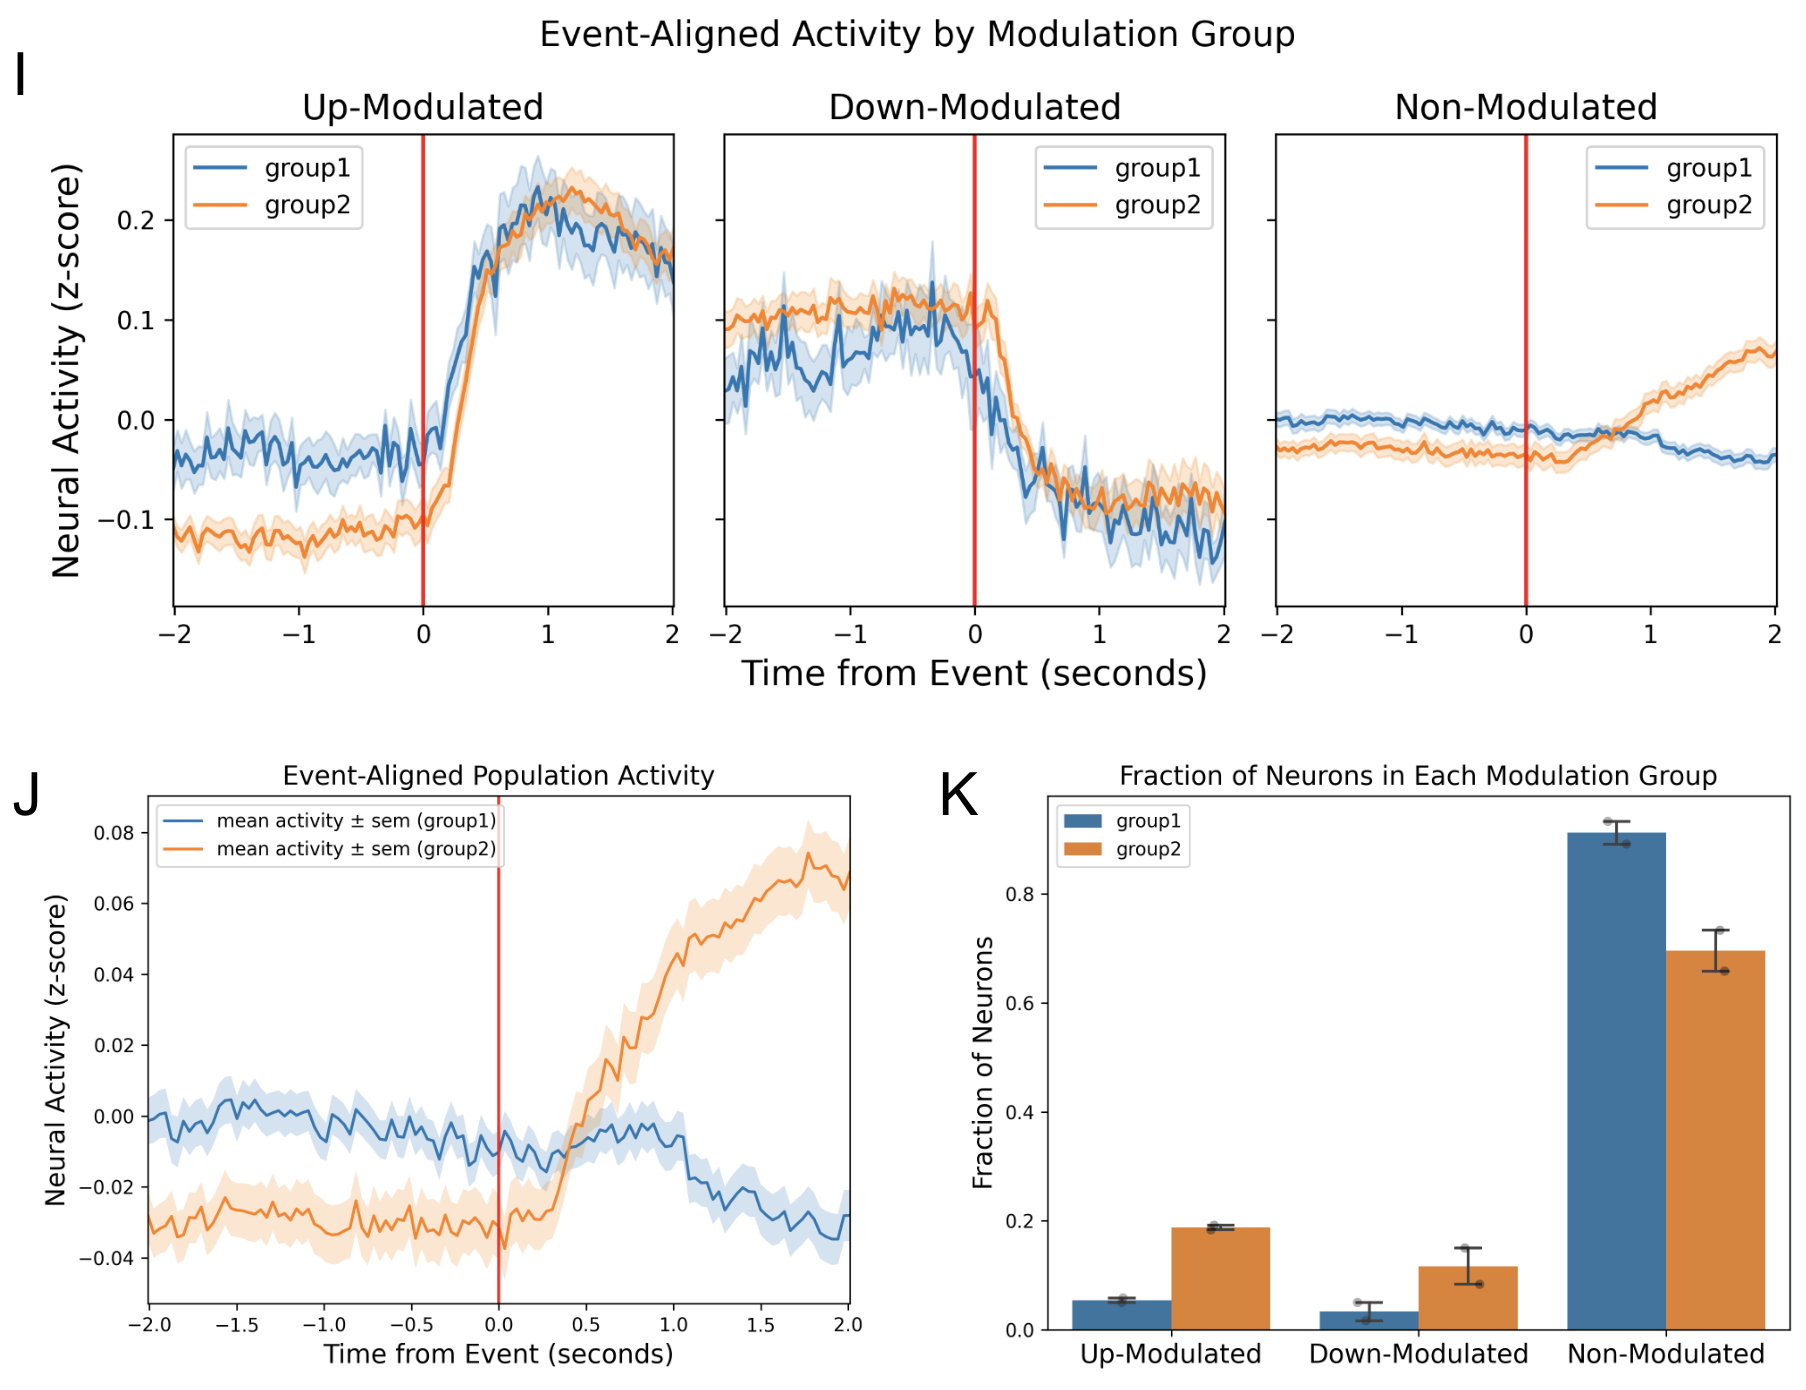
| I | Comparison of event-aligned sub-population activity between the two input groups. |
| J | Comparison of event-aligned population activity between the two input groups. |
| K | Comparison of the fraction of neurons in each modulation category between the two input groups. The mean ± sem is plotted along with the individual data points, each representing a recording session. |
Output Data
Combination Data
For each input group, two files are produced during the combination step. The two files are equivalent to those produced by the peri-event analysis workflow.
Event-Aligned Traces
A csv file containing the event-aligned activity of all cells as well as the activity of the population and sub-populations.
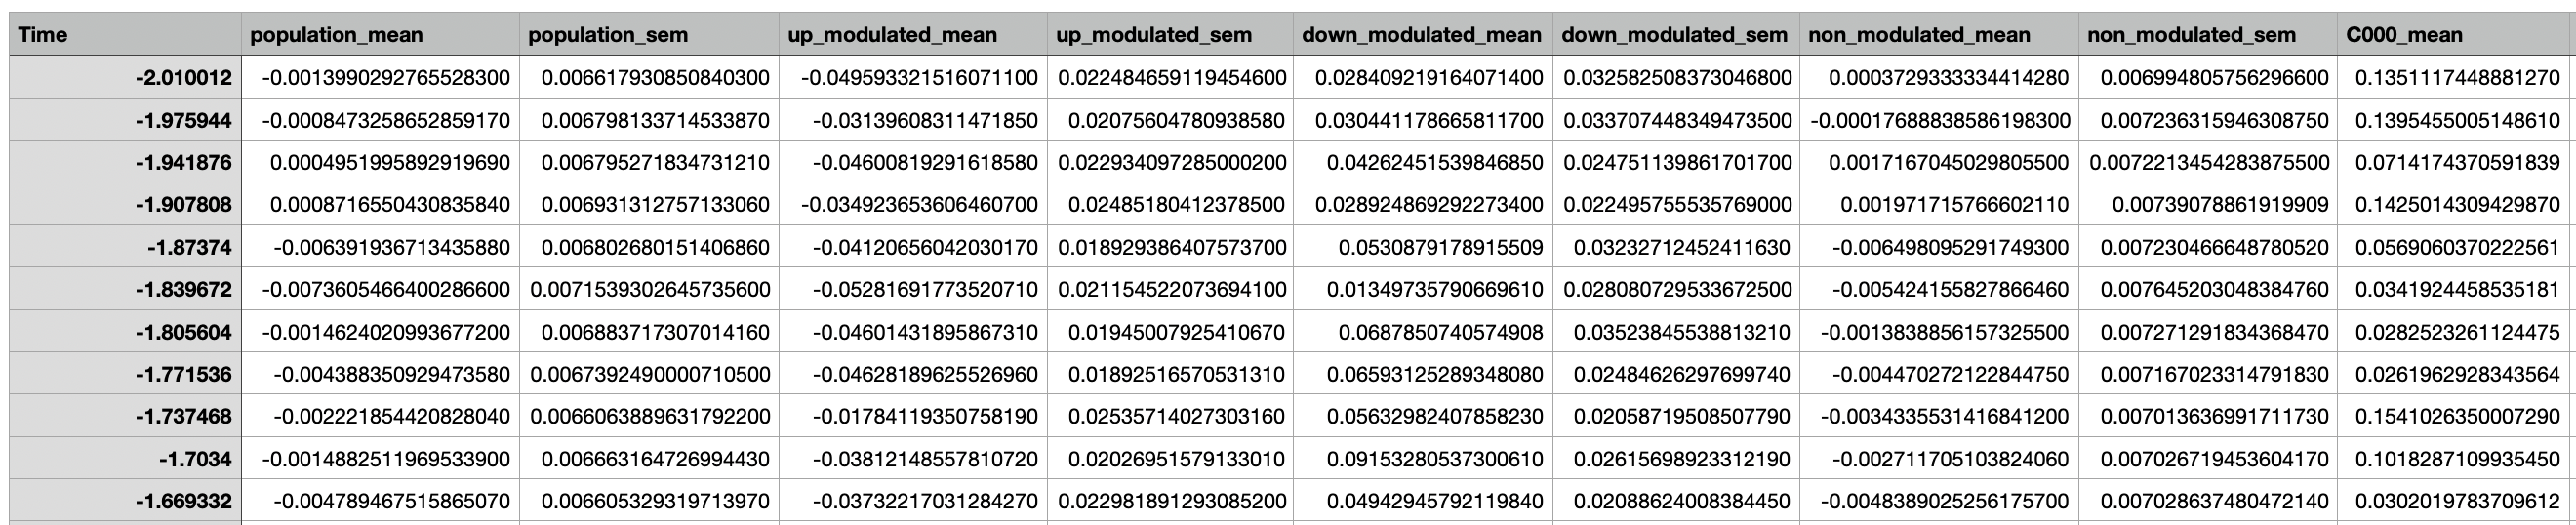
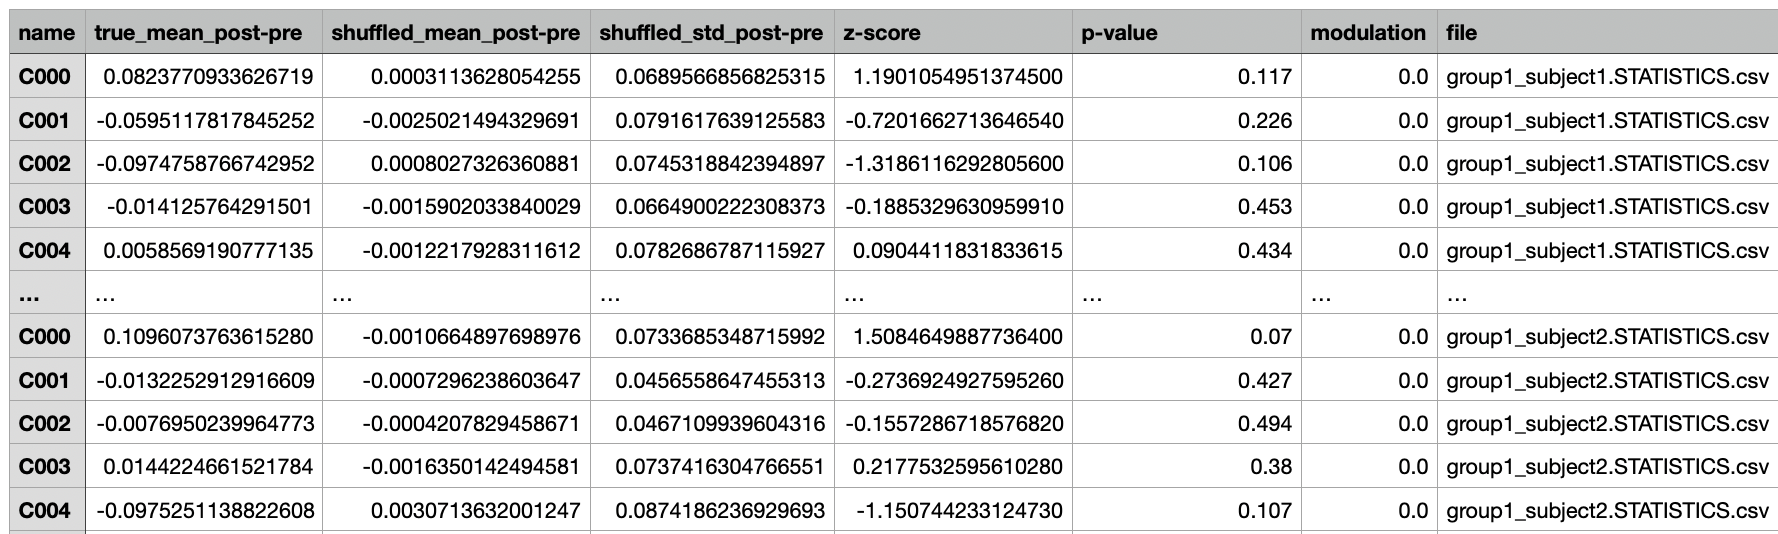
Event-Aligned Statistics
A csv file containing the data used to perform statistical tests for each cell along with corresponding
statistics and modulation classification.
Comparison Data
A single csv file containing a summary of the statistical tests performed.