This tool uses 1.0 compute credits per hour.
Compute Locomotion Metrics
This tool generates the following locomotion metrics from a sequence of keypoint estimates over time:
- Instantaneous speed: calculated from the distance between consecutive keypoint estimates
- States of rest and movement: estimated using a simple algorithm based on speed thresholds
Parameters
| Parameter | Required? | Default | Description |
|---|---|---|---|
| Annotations File | True | N/A | The input experiment annotations file containing: keypoint (x, y) coordinates, timestamps for each frame that can be used for downstream synchronization with neural data |
| Movie File | False | N/A | The parent movie that generated the keypoint estimates. If this is passed, a movie preview will be generated for the experiment annotations output with each frame of the parent movie labeled with rest and movement states. Valid file formats are: .isxb, .mp4, .avi |
| Crop Rectangle | False | N/A | If a movie file is provided, cropping rectangle as provided to the DeepLabCut task that generated the annotation file |
| Time Column Name | True | Time since start (s) | The name of the timestamps column in the input annotations file |
| Time Unit | True | s | The unit of the timestamp column in the input annotations file |
| X Column Name | True | Average keypoint x | The name of the x-coordinate column in the input annotations file |
| Y Column Name | True | Average keypoint y | The name of the y-coordinate column in the input annotations file |
| Output Annotations Format | True | Parquet | The file format of the output annotations file |
| Pixels Per Cm | False | N/A | The conversion rate between pixels and cm of the parent movie. If none, then outputs are only in pixels |
| Filter Type | True | none | Type of the filter to be applied on the speed estimates. If none, then no filtering is applied |
| Speed Filter Size | False | N/A | Size of the filter to apply on the speed estimates. If filter type is Median, filter size (aka kernel size, or window length) is defined in units of number of samples. If filter type is Gaussian, filter size (aka sigma) is defined in units of standard deviation |
| Threshold Units | True | px/s | The units of the speed thresholds: maximum rest speed threshold, and minimum movement speed threshold, used for labeling states of rest and movement |
| Maximum Rest Speed Threshold | False | N/A | Maximum threshold for speed in order to classify a frame as rest. units of threshold are in threshold units. If none, then frames are not labeled for rest and movement |
| Minimum Movement Speed Threshold | False | N/A | Minimum threshold for speed in order to classify a frame as movement. units of threshold are in threshold units. If none, then frames are not labeled for rest and movement |
| Minimum State Duration | False | N/A | Minimum duration, in seconds, for a rest- or movement-labeled block of frames. Anything shorter is labeled 'undefined' |
| Minimum Movement Distance | False | N/A | Minimum Euclidean distance, in cm if Pixels Per Cm is provided or in px otherwise, from first to last frame of each block of movement. Any smaller movement is labeled 'undefined' |
Details
Inputs
The tool expects inputs to be in the IDEAS experiment annotations format, which requires annotations to be structured in a table with one time-point (i.e., frame) per row, and one or more columns for annotations (e.g., x and y).
The tool also expects the annotations to contain columns for the x and y coordinates of the keypoint to track over time, specified by the X Column Name and Y Column Name parameters respectively. Additionally, it expects the annotations to contain a column for timestamps of each estimate, specified by the Time Column Name.
An example of an acceptable input to this tool is the experiment annotations output file generated by the Average DeepLabCut Keypoints tool.
Valid Inputs
| Source Parameter | File Type | File Format |
|---|---|---|
| Annotations File | experiment_annotations, experiment_annotations | parquet, csv |
| Movie File | nvision_movie, movie, movie | isxb, mp4, avi |
Instantaneous Speed Calculation
Instantaneous speed is calculated from keypoint estimates by computing the Euclidean distance between consecutive keypoint estimates and dividing by the time difference between consecutive frames. If the Pixels Per Cm parameter is specified, then the speed is converted from px/s to cm/s.
Rest and Movement State Estimation
States of rest and movement are estimated using a simple algorithm based on the Maximum Rest Speed Threshold and Minimum Movement Speed Threshold parameters. If the speed is less than or equal to the Maximum Rest Speed Threshold, then the frame is labeled rest. If the speed is greater than the Minimum Movement Speed Threshold, then the frame is labeled move. If the speed is in between the two thresholds, then the frame is labeled undefined.
If either the Maximum Rest Speed Threshold or Minimum Movement Speed Threshold parameters are not specified, then this step of the tool is skipped.
Outputs
Locomotion Metrics
The locomotion metrics are output in IDEAS experiment annotations format. This file can be either a .parquet or .csv file depending on the Output Annotations Format parameter.
The file will contain the following columns:
- Displacement (px): The per-frame displacement in pixels.
- Speed (px/s): The instantaneous speed in pixels per seconds.
- Smoothed Speed (px/s): Gaussian filtered speed in pixels per seconds. This column will only be in the annotations if the
Filter Speedparameter is set to True. - Displacement (cm): The per-frame displacement in centimeters. This column will only be in the annotations if the
Pixels Per Cmparameter is specified. - Speed (cm/s): The instantaneous speed in centimeters per seconds. This column will only be in the annotations if the
Pixels Per Cmparameter is specified. - Smoothed Speed (cm/s): Gaussian filtered speed in centimeters per seconds. This column will only be in the annotations if the
Filter Speedparameter is set to True and thePixels Per Cmparameter is specified. - State: Rest, move, or undefined states for each frame based on speed thresholds. This column will only be in the annotations if the
Maximum Rest Speed ThresholdandMinimum Movement Speed Thresholdparameters are specified.
In addition, the tool will propagate the columns of the input annotations. When running the tool on the outputs of the Average DeepLabCut Keypoints tool, the following columns are included in the output annotations: Frame number, Time since start (s), Hardware counter (us), Average keypoint x, and Average keypoint y. The first three of these columns contain important timing metadata about the results, which will be used in downstream analyses in order to map these behavior results to neural data. The following table shows an example of this file:
| Frame number | Time since start (s) | Hardware counter (us) | Average keypoint x | Average keypoint y | Displacement (px) | Speed (px/s) | Smoothed Speed (px/s) | Displacement (cm) | Speed (cm/s) | Smoothed Speed (cm/s) | State |
|---|---|---|---|---|---|---|---|---|---|---|---|
| 0 | 0.0 | 247903537725.0 | 494.0040043422154 | 415.5110539027623 | 29.005753815209786 | 2.9005753815209787 | rest | ||||
| 1 | 0.052012 | 247903589737.0 | 494.3198699951172 | 417.4007219587053 | 1.9158852972801972 | 36.835447536726086 | 75.02198242991568 | 0.1915885297280197 | 3.6835447536726087 | 7.502198242991568 | move |
| 2 | 0.100012 | 247903637737.0 | 493.5560368129185 | 424.491446358817 | 7.131746886182038 | 148.57806012879243 | 103.43969501356901 | 0.7131746886182038 | 14.857806012879243 | 10.3439695013569 | move |
| 3 | 0.15201 | 247903689735.0 | 491.2410409109933 | 429.7851126534598 | 5.777725232733714 | 111.1143742592737 | 96.02808974478721 | 0.5777725232733715 | 11.11143742592737 | 9.602808974478721 | move |
| 4 | 0.200012 | 247903737737.0 | 488.97420610700334 | 430.5046822684152 | 2.37830201180324 | 49.54589416697721 | 61.577474410340926 | 0.237830201180324 | 4.954589416697721 | 6.157747441034092 | move |
| ... | ... | ... | ... | ... | ... | ... | ... | ... | ... | ... |
Previews
The output annotations file will have the following previews which visualize the results.
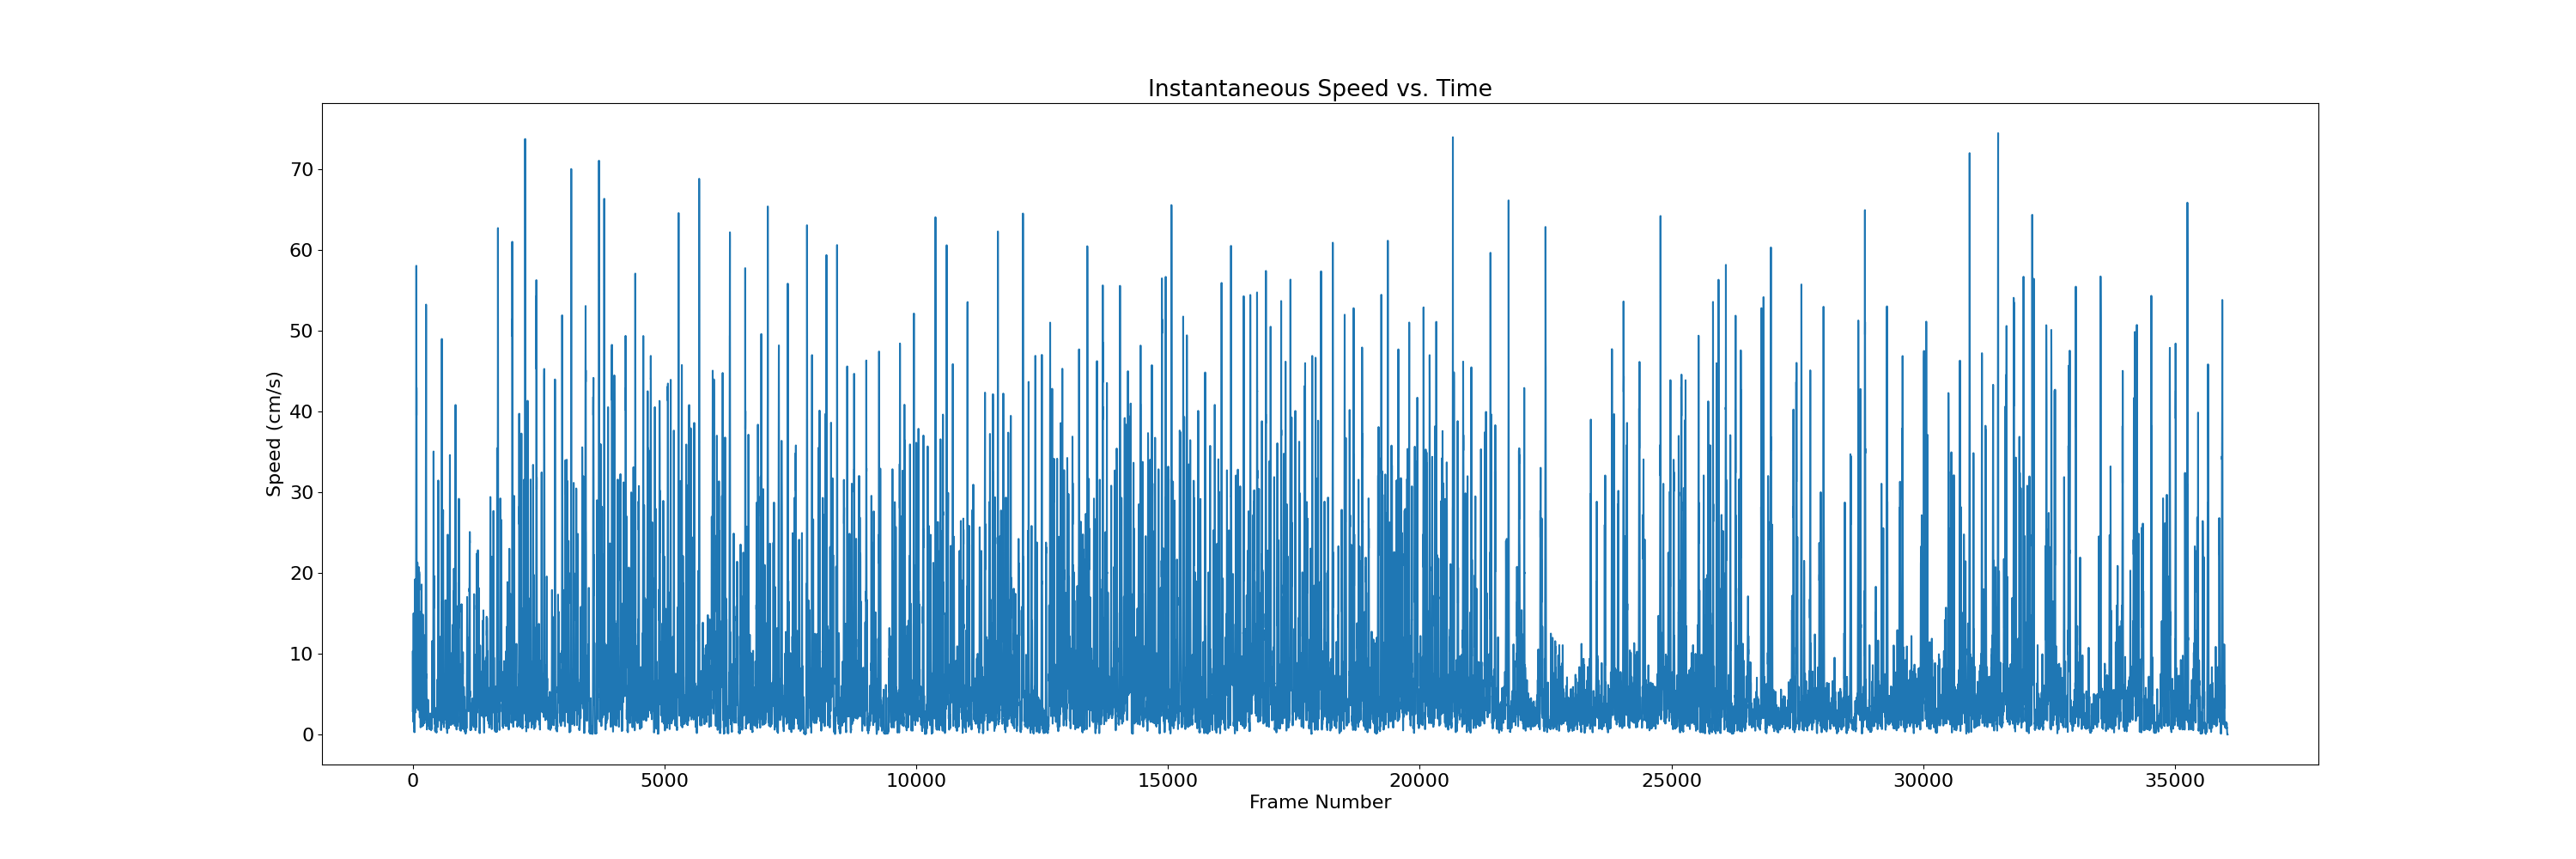
Instantaneous speed vs. time:
This preview shows a plot of the instantaneous speed over time. This plot can highlight how animal speed changes over time.
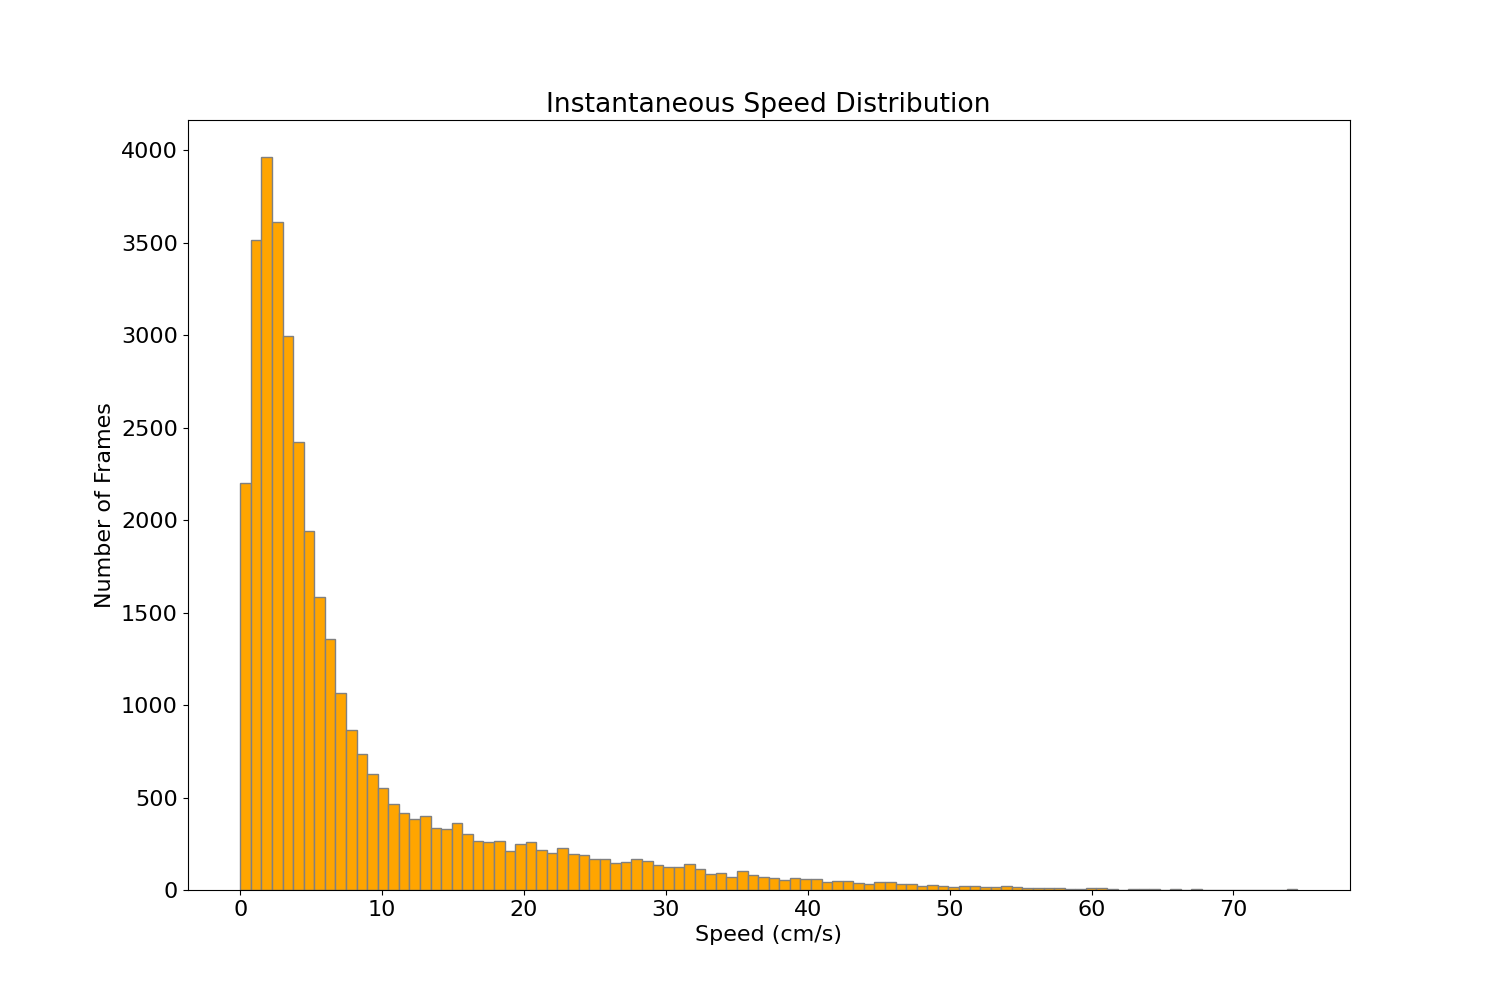
Instantaneous speed distribution:
This preview shows a plot of the distribution of instantaneous speed. This plot can emphasize which speeds are both most and least common for an animal.
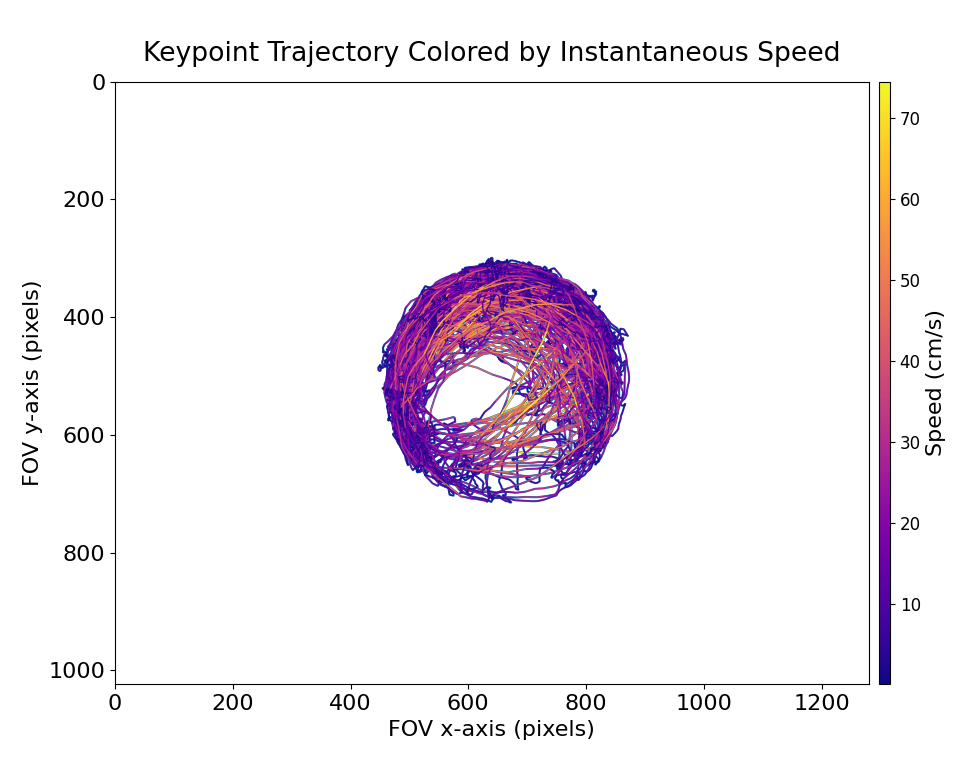
Keypoint trajectory colored by velocity:
This preview shows the input keypoint plotted in the input field of view (FOV). Each point is colored by speed, where keypoint estimates with lower speed are plotted with cooler colors, and keypoint estimates with higher speed are plotted with warmer colors. This plot can provide insight on which areas of the FOV the animal is moving faster or slower.
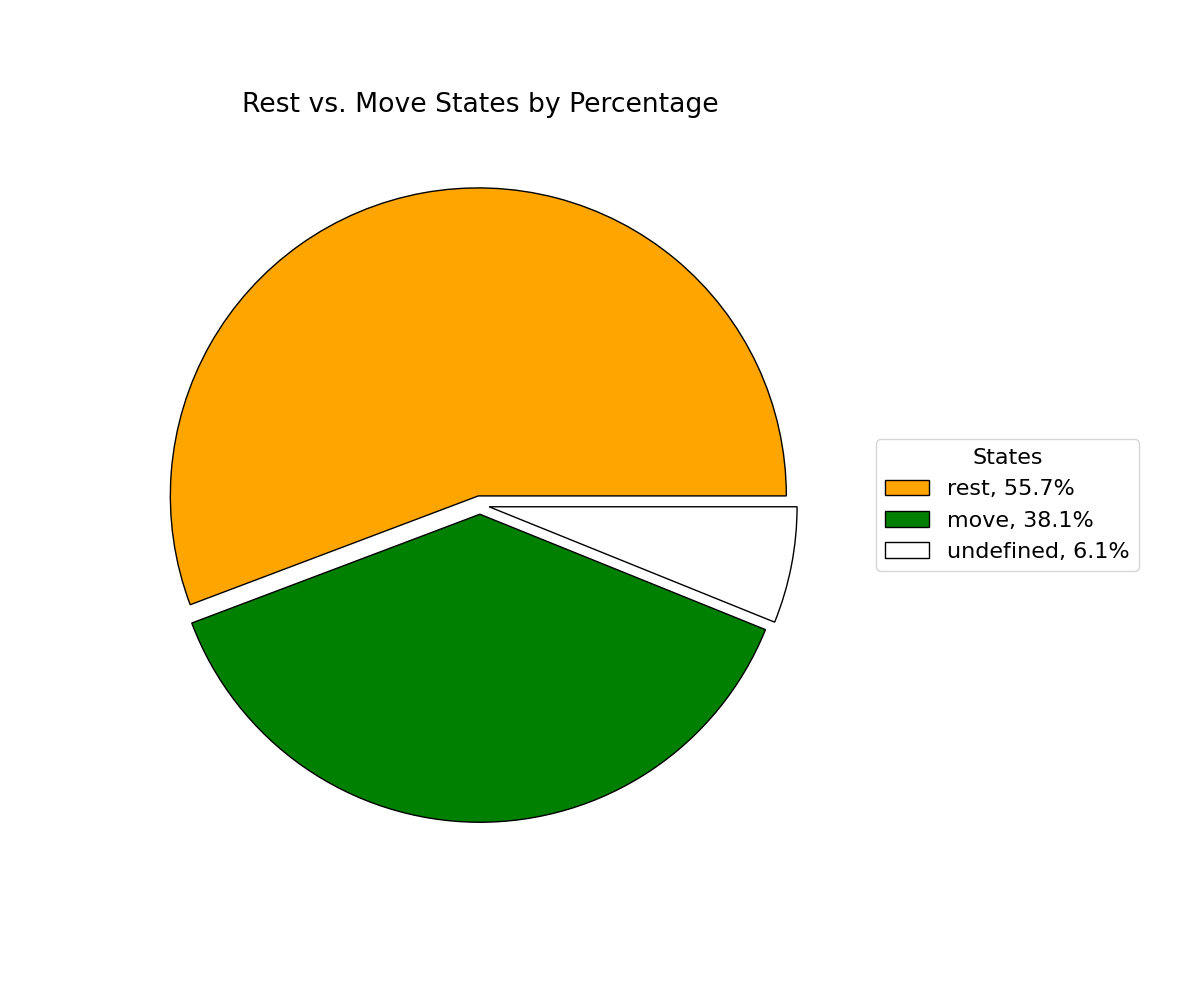
State pie chart:
This preview is a pie chart of the percentage of frames labeled one of the following states: rest, move, and undefined.
This preview is only generated if the Maximum Rest Speed Threshold and Minimum Movement Speed Threshold parameters are specified.
The chart shows which states occur most often throughout the duration of the movie.
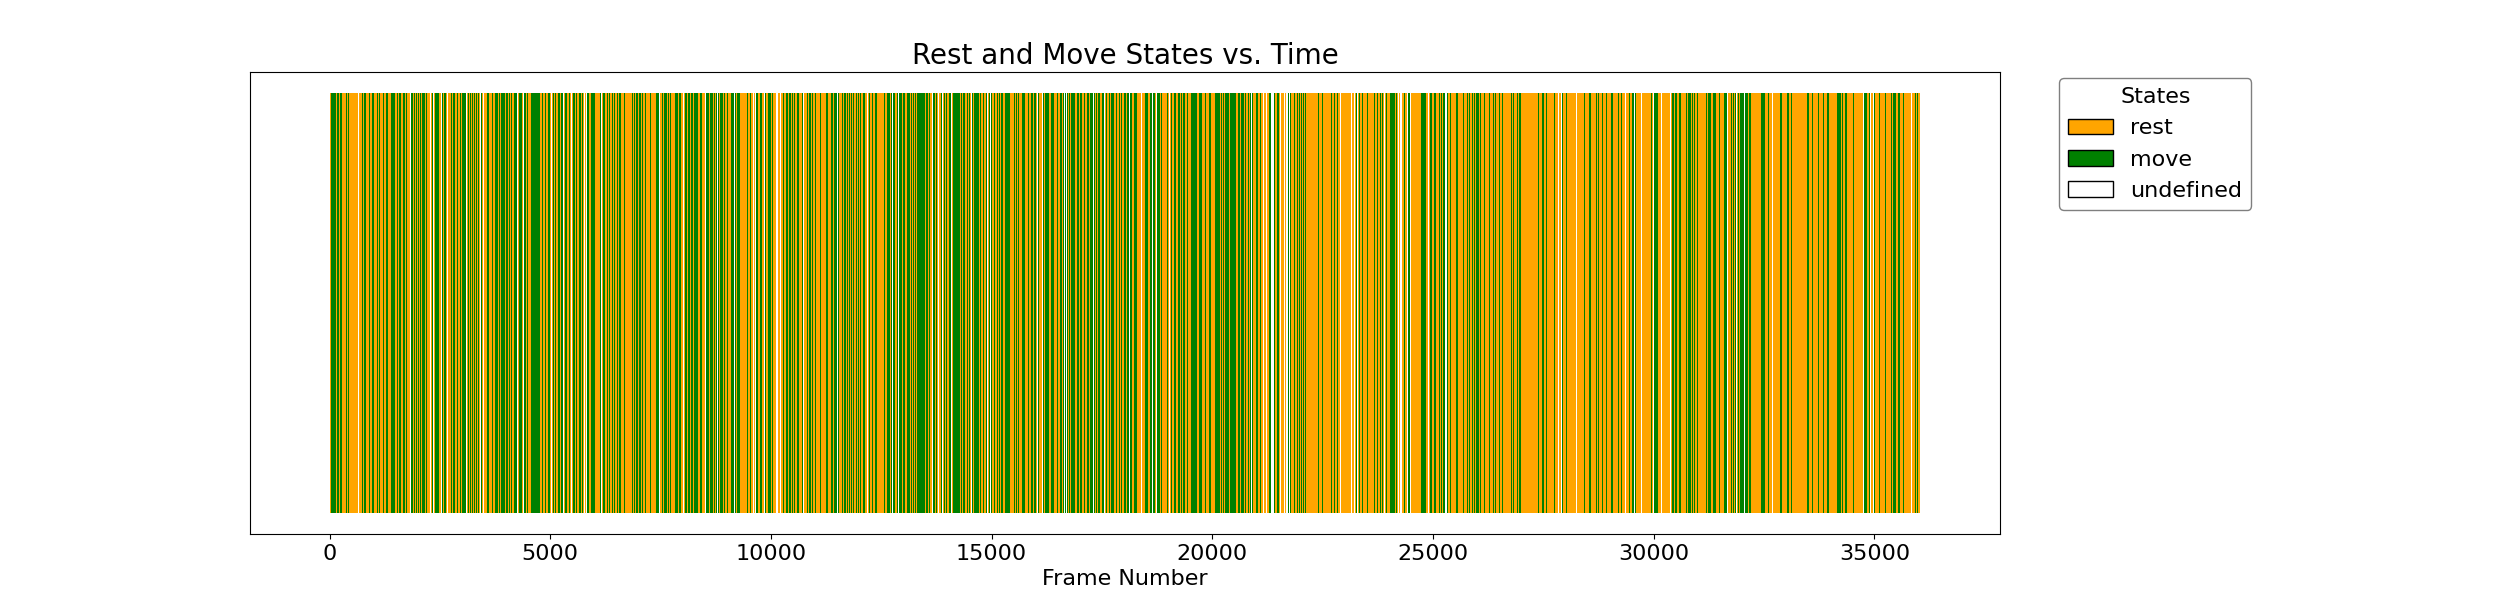
State vs. time:
This preview shows a plot of the instantaneous speed over time.
This preview is only generated if the Maximum Rest Speed Threshold and Minimum Movement Speed Threshold parameters are specified.
The plot can highlight how animal speed changes over time.
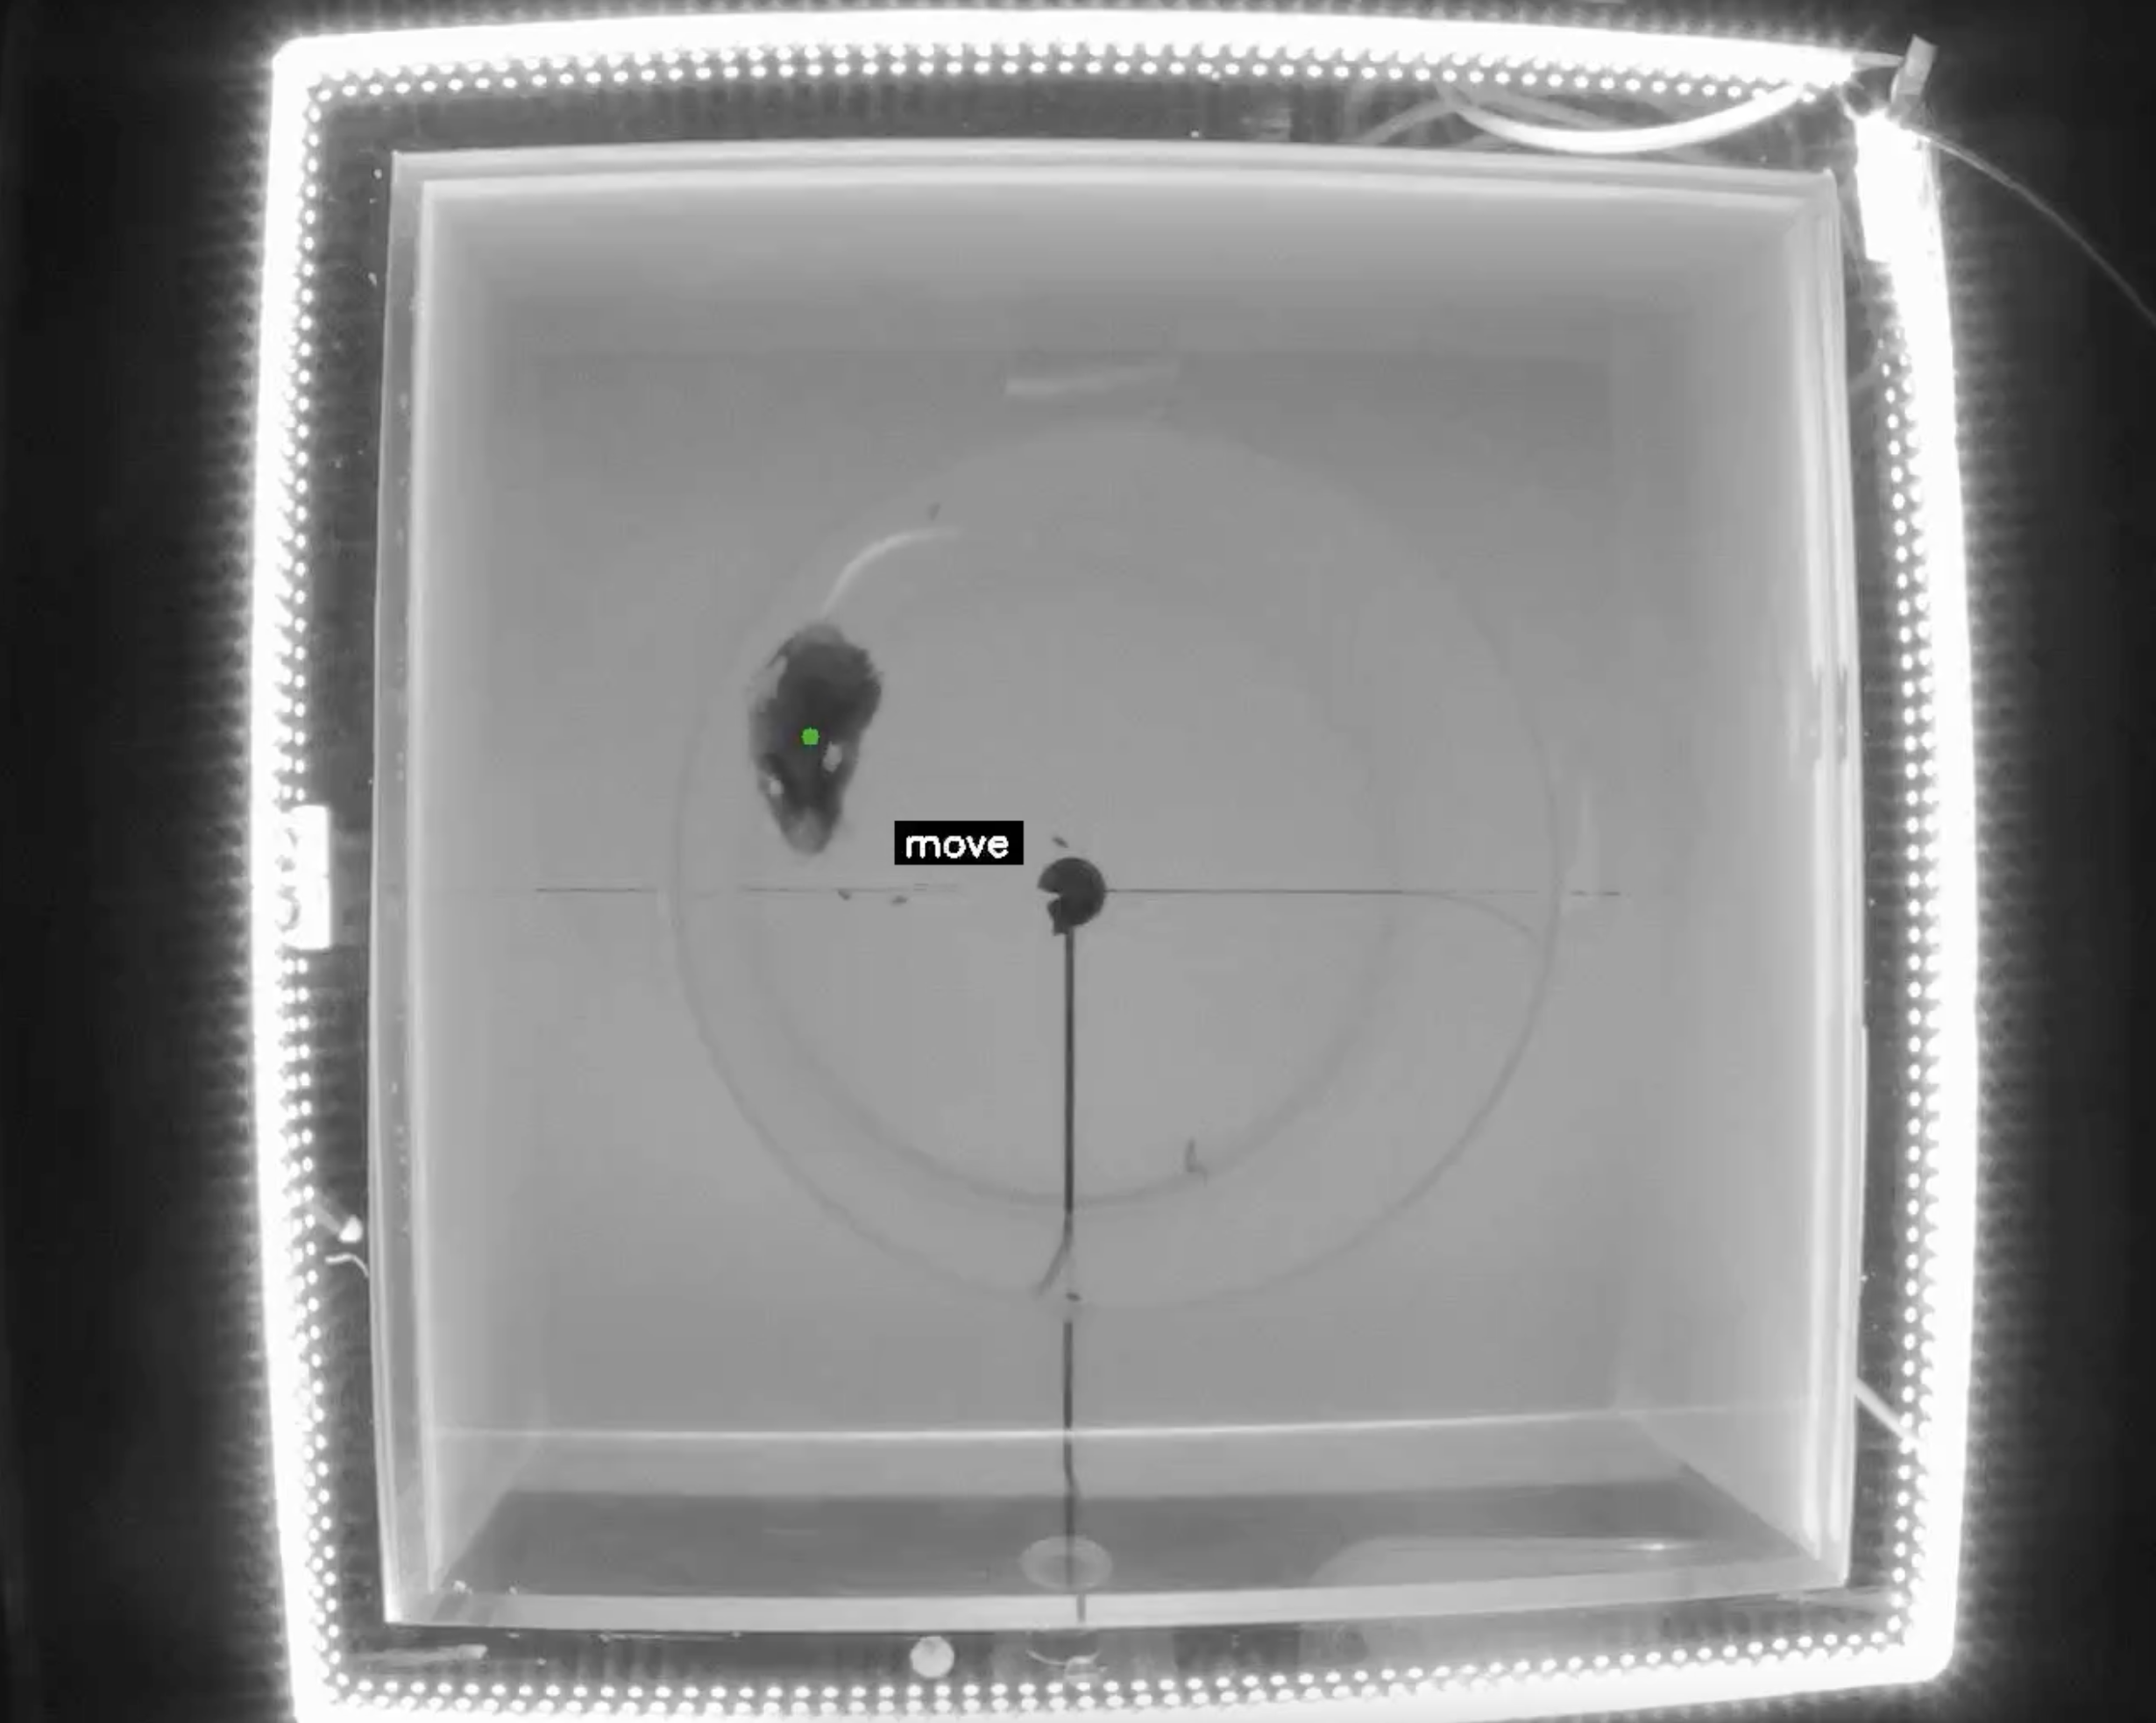
Movie annotated with states:
This preview is a movie with the frames of the input movie annotated with a circle representing the corresponding keypoint and a label indicating the state assigned to the frame.
This preview is only generated if the parent movie of the input annotations is passed to the Input Movie File parameter, and the Maximum Rest Speed Threshold and Minimum Movement Speed Threshold parameters are specified.
This annotated movie can help determine the quality of the results, by showing whether or not the assigned state corresponds to the behavior of the animal.
Next Steps
After running this tool, the outputs can be used as input to one of the following tools:
- Compare Neural Activity Across States: Compute population activity during states of rest and movement.
- Compare Neural Circuit Correlations Across States: Compute correlations of cell activity during states of rest and movement.