Average DeepLabCut Keypoints
This tool uses 1.0 compute credits per hour.
DeepLabCut is an open-source library for pose estimation based on deep learning. By applying a pre-trained DeepLabCut model on a behavior movie, pose estimates can be generated for every frame of the movie. For example, the Inscopix Bottom View Mouse Pose Estimation tool applies a pre-trained DeepLabCut model on Inscopix behavior movies and generates an output of pose estimates.
Each pose estimate consists of a set of keypoints (i.e., x and y coordinates), where each keypoint corresponds to a fixed anatomical location on an animal. This tool aggregates that information. For every DeepLabCut pose estimate, it averages all the keypoints. This can be used as a proxy for animal center of mass (COM), which can then be used for further analysis, such as computing speed or labeling states of rest and movement.
Parameters
| Parameter | Required? | Default | Description |
|---|---|---|---|
| Annotations File | True | N/A | The input experiment annotations file containing: DeepLabCut keypoints, timestamps for each frame that can be used for downstream synchronization with neural data. Valid file formats are: .parquet and .csv. |
| Movie File | False | N/A | The parent movie that generated the DeepLabCut keypoint estimates. If this is passed, a movie preview will be generated for the experiment annotations output with each frame of the parent movie labeled with the average keypoint estimate. Valid file formats are: .isxb, .mp4, .avi |
| Crop Rectangle | False | N/A | If a movie file is provided, optionally specify a crop rectangle to apply while generating the output movie preview. This is helpful if cropping was applied on the DeepLabCut task that generated the annotation file; the same crop rectangle can be copied and pasted here. |
| Output Annotations Format | True | Parquet | The file format of the output annotations file. |
| Keypoints To Exclude | False | N/A | List of keypoints, separated by commas, to exclude from the average computation. If empty, then no keypoints are excluded. |
| Likelihood Threshold | True | 0.6 | Drop keypoints below this likelihood threshold. |
| Median Filter Length | True | 1 | Length of the median filter, in samples, applied on the estimates of each keypoint. If 1, then no filtering is applied. |
| Interpolate Nans | True | True | Flag indicating whether to interpolate over nans. |
| Drop Keypoint Jumps | True | False | Flag indicating whether to correct for jumps in keypoints. |
| Pixels Per Cm | False | N/A | The conversion rate between pixels and cm of the parent movie. If provided, then max distance thresholds are defined in units of cm. If none, then they are defined in units of pixels. |
| Max Distance Between Keypoint and Mean | True | 300.0 | If drop keypoint jumps is true, the maximum distance between a keypoint and the average of all keypoints for a given frame. Drop any keypoints that exceed this threshold (generally much larger than a mouse body). Units of threshold are in cm if Pixels Per Cm is provided, or in pixels if not. |
| Max Distance Between Keypoints | True | 400.0 | If drop keypoint jumps is true, the maximum distance between any pair of keypoints for a given frame. Drop the entire frame if the distance between any pair of keypoints exceeds this threshold. Units of threshold are in cm if Pixels Per Cm is provided, or in pixels if not. |
| Min Keypoints | True | 1 | Minimum number of keypoints required per frame (i.e., not nans). Drop frames below this threshold. Set to 1 for no thresholding. |
Details
Inputs
The tool expects inputs to be in the IDEAS experiment annotations format, which requires annotations to be structured in a table with one time-point (i.e., frame) per row, and one or more columns for annotations (e.g., x and y).
The tool also expects the annotations to contain three columns for every body part estimated by DeepLabCut, <body_part> x, <body_part> y, and <body_part> likelihood, where <body_part> is the name of a body part estimated by the DeepLabCut model. The tool will automatically detect these columns and construct a set of unique body part names, and then average keypoints across all body parts.
An example of an acceptable input to this tool is the experiment annotations output file generated by the Inscopix Bottom View Mouse Pose Estimation tool.
Valid Inputs
| Source Parameter | File Type | File Format |
|---|---|---|
| Annotations File | experiment_annotations, experiment_annotations | csv, parquet |
| Movie File | nvision_movie, movie, movie | isxb, mp4, avi |
Filtering
Before averaging keypoints, the tool applies the following filtering steps to remove noise and outliers from the keypoint estimates:
- Exclude keypoints: Drop keypoint columns specified by the
Keypoints To Excludeparameter. This can be helpful when there are certain keypoints estimated by the model which are unreliable. For instance, outputs of the Inscopix Bottom View Mouse Pose Estimation tool can have noisy estimates fortail_tip, so it's often recommended to exclude that body part from this analysis. - Drop keypoints with low likelihood: Drop keypoint (x, y) estimates in the input annotations if the corresponding likelihood of the keypoint is below the
Likelihood Thresholdparameter. - Drop keypoints far from average: This step is only executed if the
Drop Keypoint Jumpsparameter is set toTrue. Drop any keypoint (x, y) estimates in the input annotations if distance between the keypoint and the corresponding average of all keypoints is greater than theMax Distance Between Keypoint and Meanparameter. - Drop keypoints far from each other: This step is only executed if the
Drop Keypoint Jumpsparameter is set toTrue. Drop any rows in the input annotations if distance between any two keypoints is greater than theMax Distance Between Keypointsparameter. - Drop rows that have less than min keypoints: Drop any rows in the input annotations where the number of keypoints estimated (i.e., not NaN/undefined) is less than the
Min Keypointsparameter. - Apply median filter: Apply a median filter on each column of the input annotations. If the
Median Filter Lengthparameter is one, then no filtering is performed.
Outputs
Average Keypoints
The average keypoints are output in IDEAS experiment annotations format. This file can be either a .parquet or .csv file depending on the Output Annotations Format parameter.
The file will contain two columns Average keypoint x and Average keypoint y, containing the results of the tool. In addition, it will also propagate any additional columns from the input annotations that do not contain keypoint estimates. For instance, when running this tool on the output of the Inscopix Bottom View Mouse Pose Estimation tool, it will propagate the columns Frame number, Time since start (s), and Hardware counter (us). These columns contain important timing metadata about the results, which wil be used in downstream analyses in order to map these behavior results to neural data. The following table shows an example of this file:
| Frame number | Time since start (s) | Hardware counter (us) | Average keypoint x | Average keypoint y |
|---|---|---|---|---|
| 0 | 0.0 | 247903537725.0 | 494.0040043422154 | 415.5110539027623 |
| 1 | 0.052012 | 247903589737.0 | 494.3198699951172 | 417.40072195870533 |
| 2 | 0.100012 | 247903637737.0 | 493.55603681291853 | 424.491446358817 |
| 3 | 0.15201 | 247903689735.0 | 491.2410409109933 | 429.7851126534598 |
| 4 | 0.200012 | 247903737737.0 | 488.97420610700334 | 430.5046822684152 |
| ... | ... | ... | ... | ... |
Previews
The output annotations file will have the following previews which visualize the results.
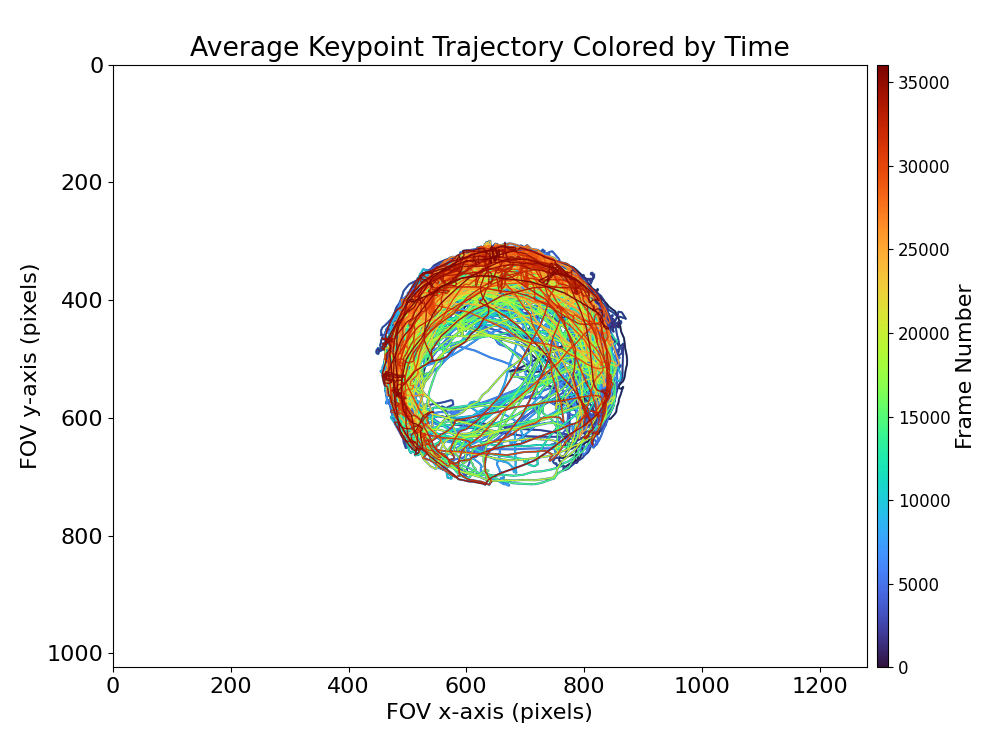
Average keypoint trajectory colored by time:
This preview shows the average keypoints plotted in the input field of view (FOV). Each point is colored by time, where keypoints occurring earlier in the movie are plotted with cooler colors, and keypoints occurring later in the movie are plotted with warmer colors. This plot can provide insight on which areas of the FOV the animal was in throughout the duration of the recording.
Average keypoint pixel density heatmap:
This preview also shows the average keypoints plotted in the input FOV. However, in this preview, each point is colored by density, that is, the number of times the average keypoint occurred in a particular pixel of the FOV. This plot can highlight the areas of the FOV the animal spent the most time in.
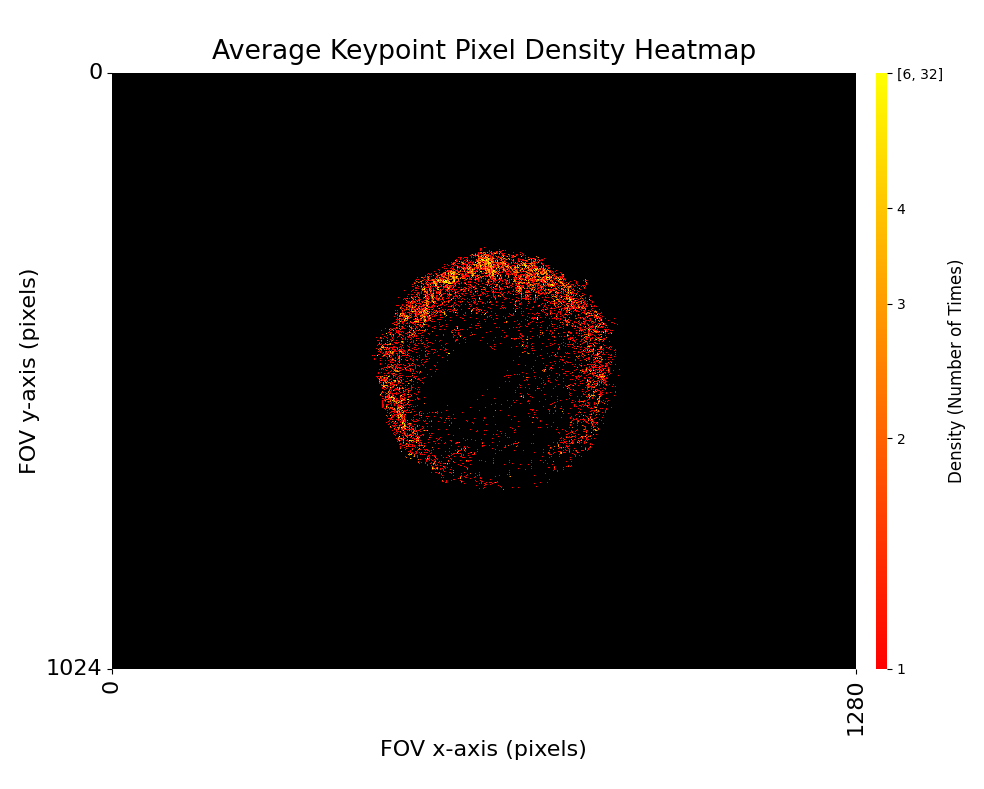
The color bar of this plot uses a logarithmic scale, since there are generally many pixels with low density, and few pixels with high density. In addition, the maximum value of the color bar is capped to the 99th percentile of density. This is to prevent the colors in the plot from saturating due to a very small percent of pixels with very high density. For instance, in the figure above, the 99th percentile of density is 6. This is why the top end of the color bar is labeled with [6, 32], indicating all pixels with a density in the range 6 - 32 are colored with the top color in the color map.
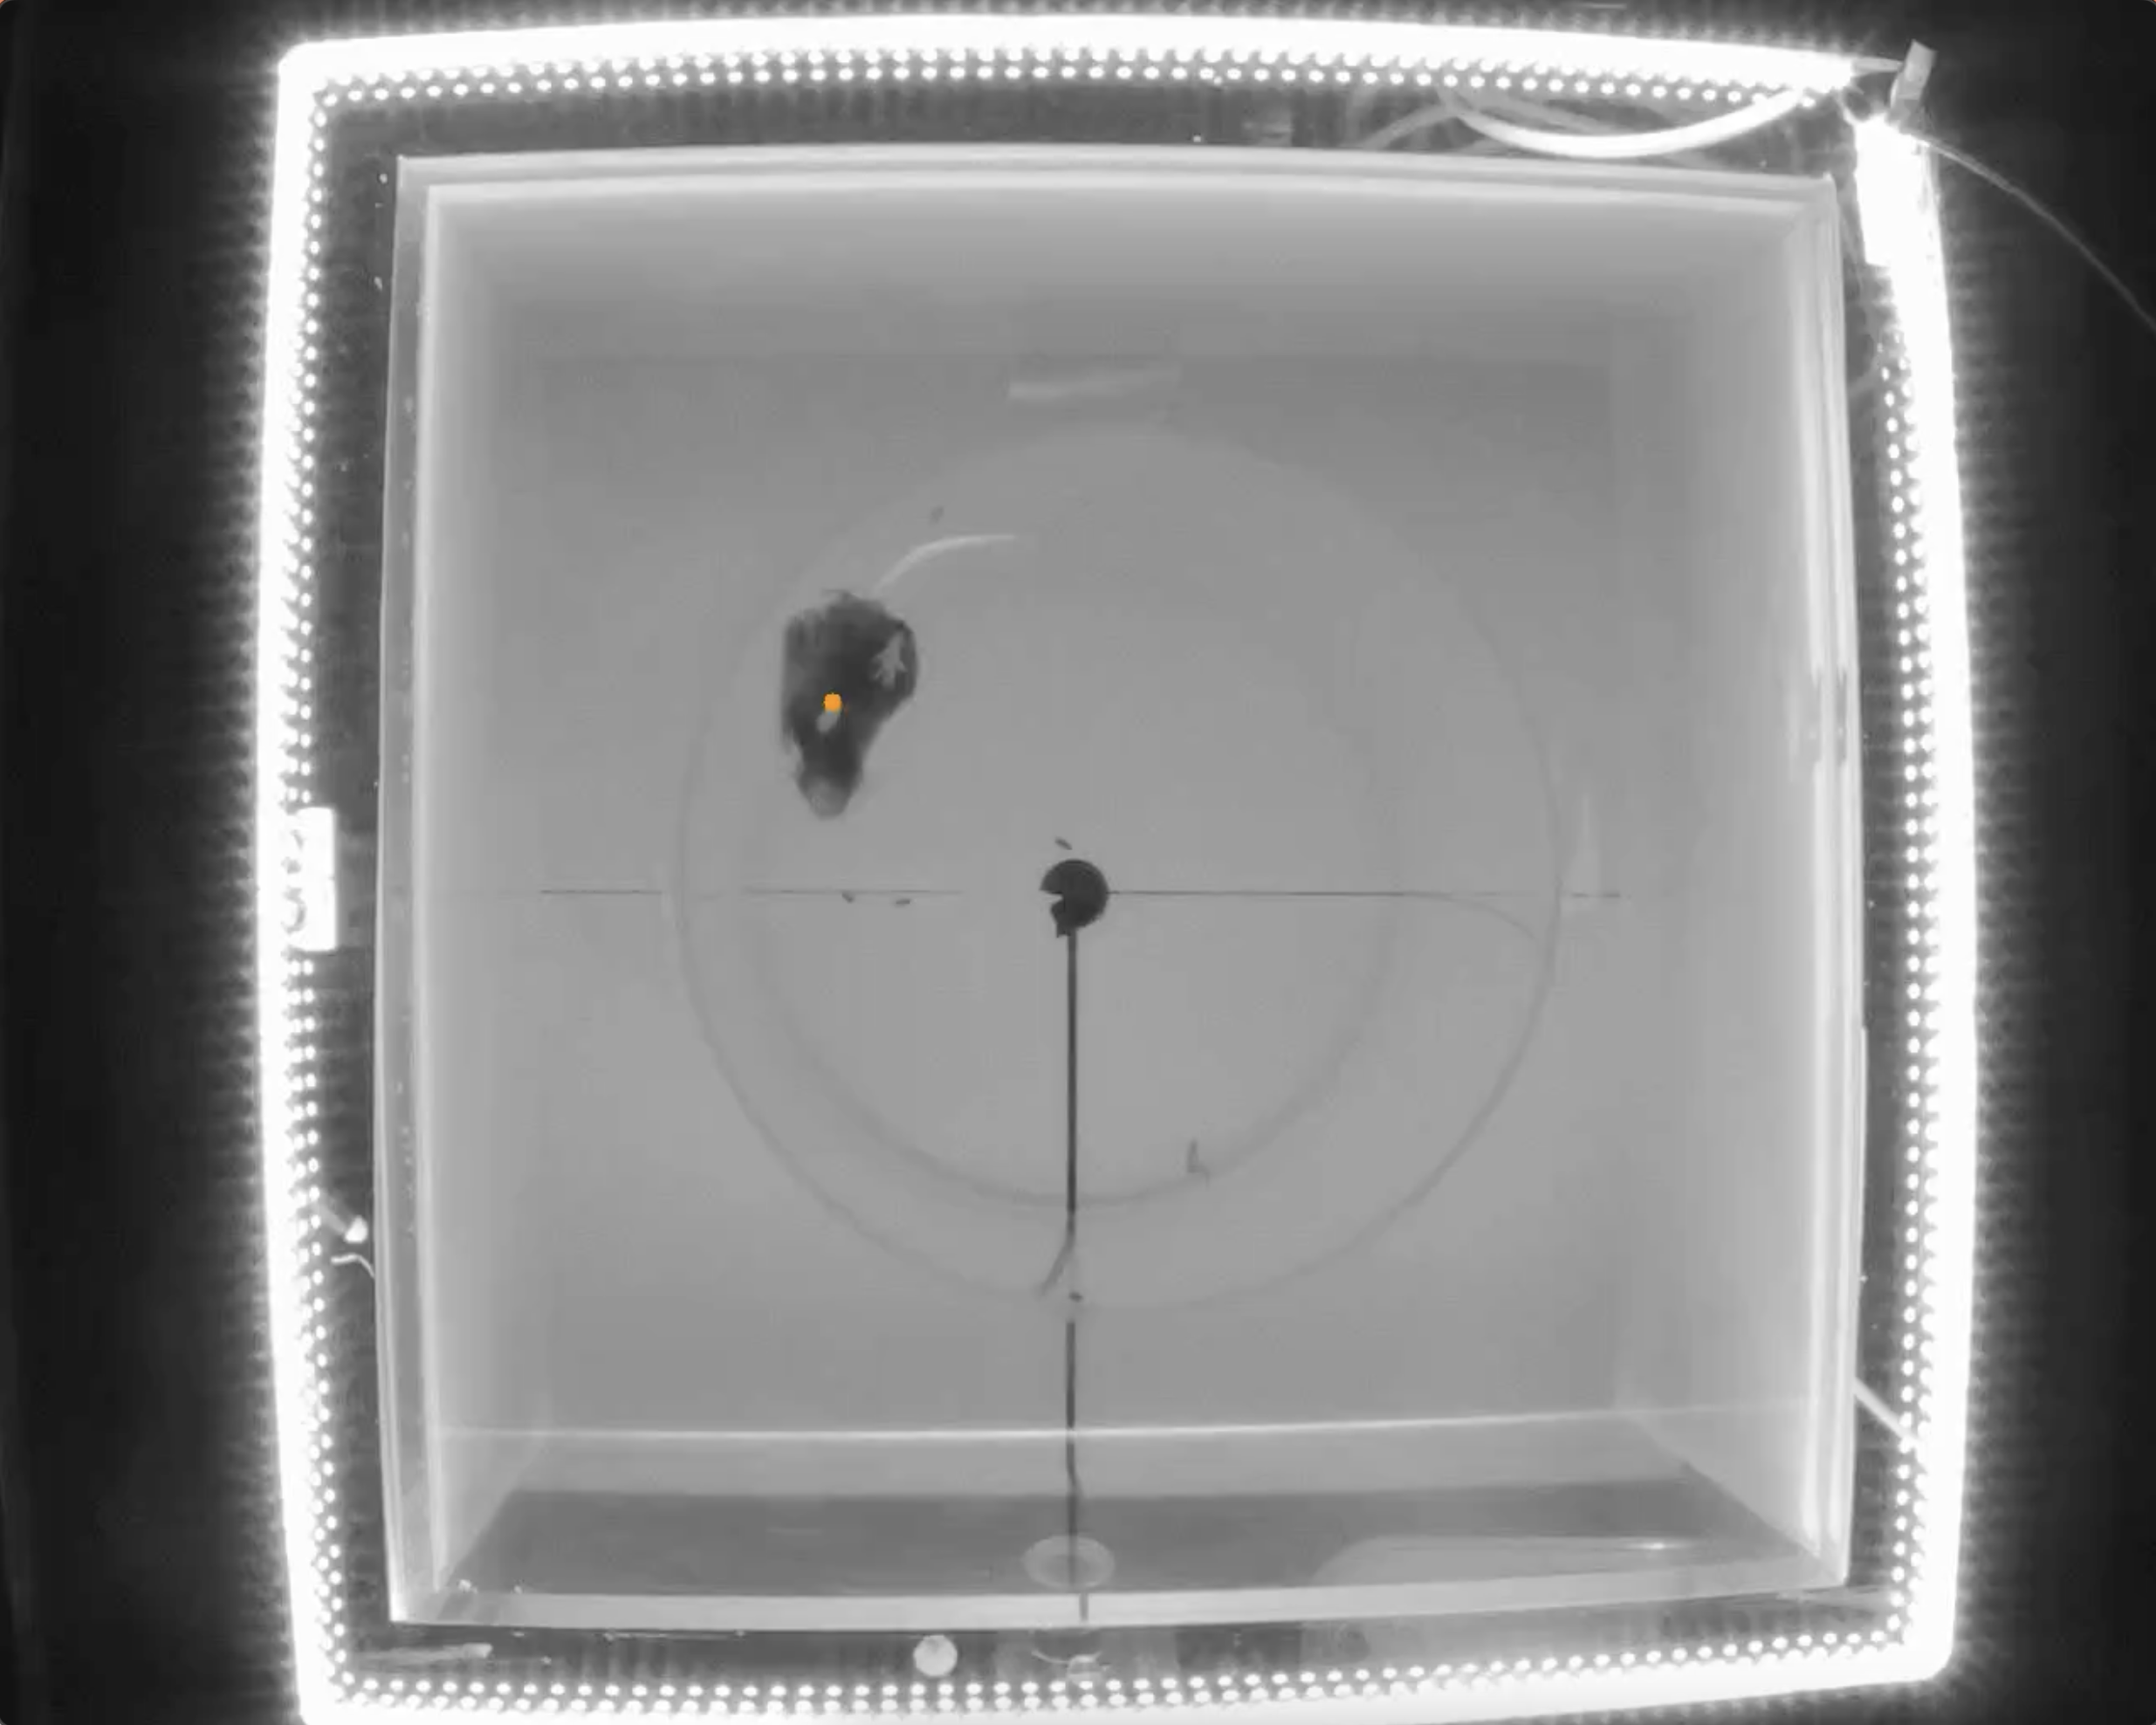
Movie annotated with average keypoints:
This preview is a movie with the frames of the input movie annotated with an orange circle representing the corresponding average keypoint.
This preview is only generated if the parent movie of the input annotations is passed to the Input Movie File parameter.
This annotated movie can help determine the quality of the results, by showing whether or not the average keypoint actually represents something close to the animal COM.
Next Steps
After running this tool, use the outputs as input to the Compute Locomotion Metrics tool. This tool will compute instantaneous speed and label states of rest and movement from the averaged keypoints.