Analyze data
Once you've created a project, a data table, and have uploaded data, you may be ready to start analyzing your data. This section covers how to create analysis tables and set them up to perform analyses.
Create an analysis table
The first step in running any analysis is to create and set up an analysis table which will be specific for the tool you wish to run. In general, an analysis table consists of input files required for the tool, parameters the tool will use during execution, and the results.
Analysis tables can be created using the following methods:
-
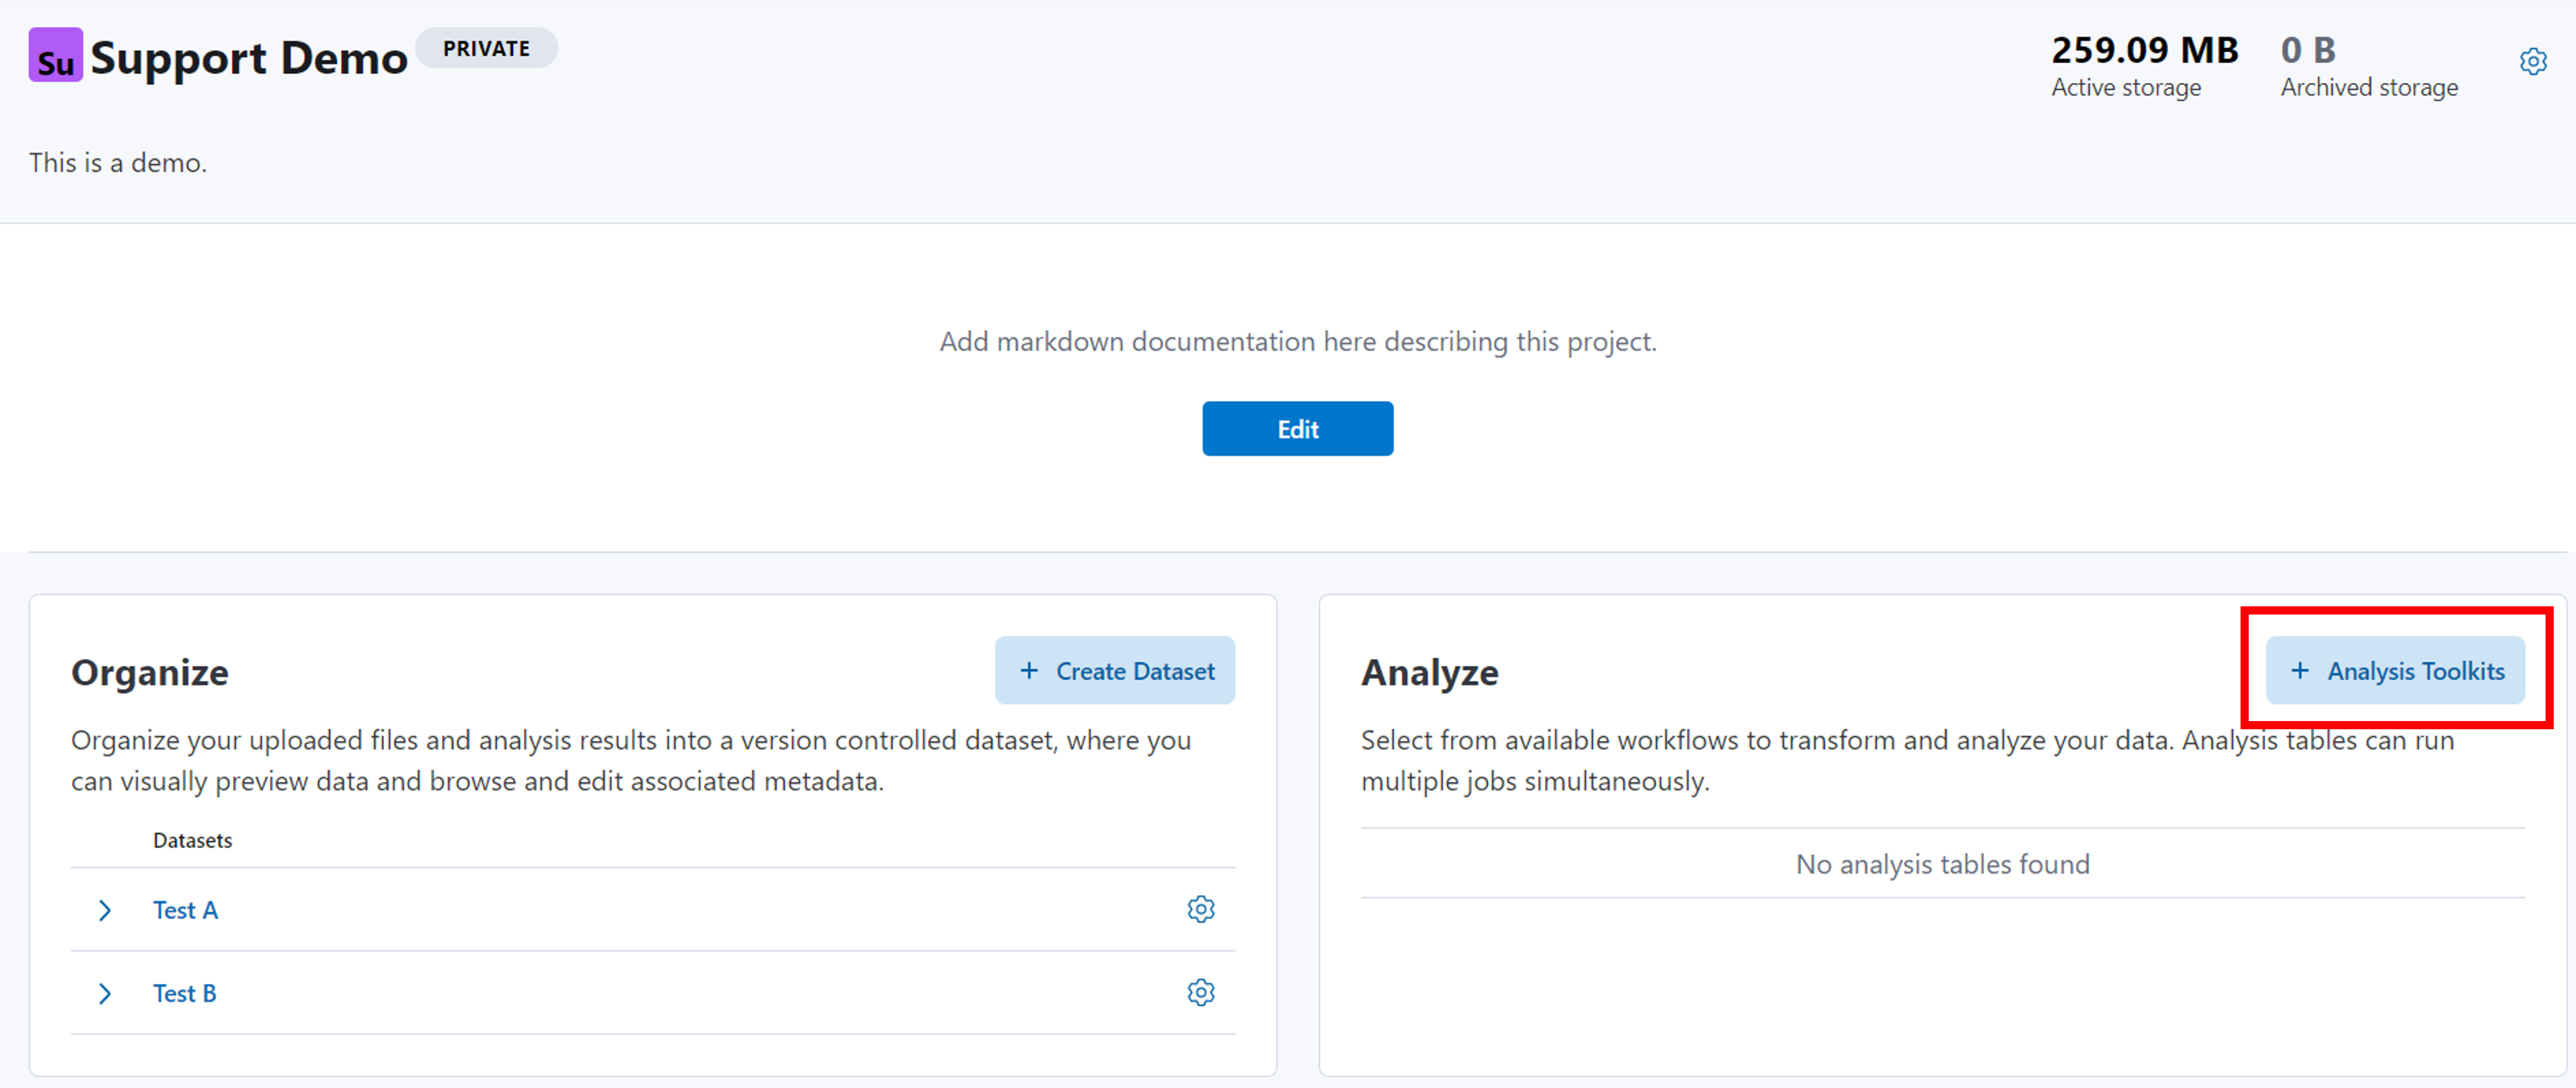
Project home page
Click the + Add link from the project home page and select Analysis table.
-
Data table
Navigate to a data table containing the input files you want to use for the analysis. Click on the Insert new analysis from either the icon in the action bar or within the Insert menu.
Note
The advantage of creating the analysis table directly from a data table is that it will be easier to map inputs from the data table and automatically add the results to the data table!
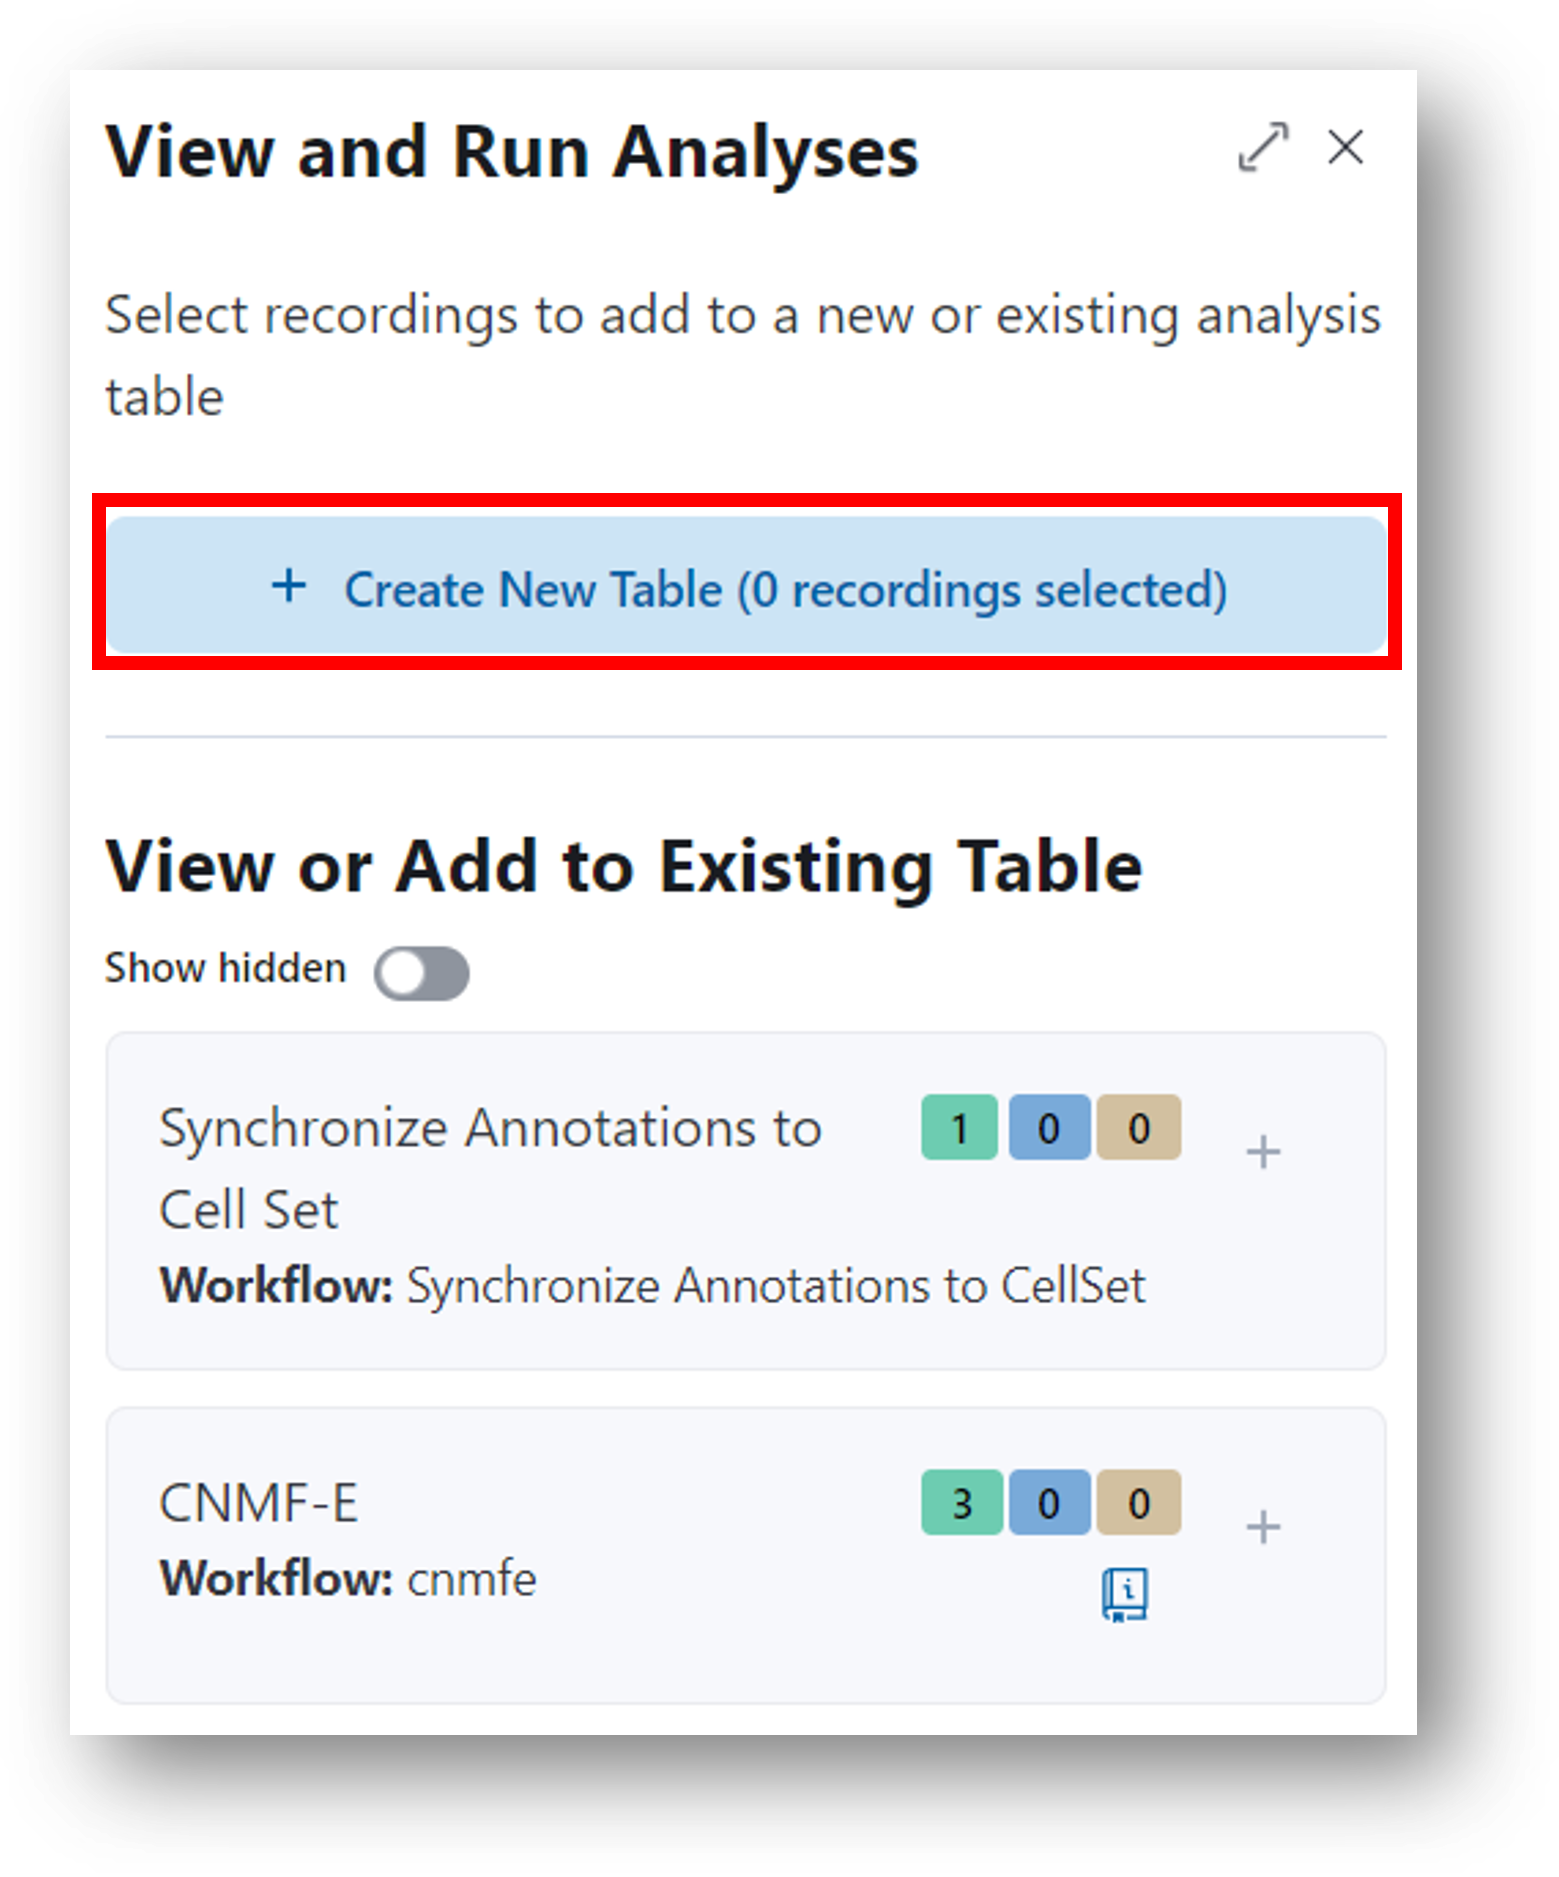
Follow the 4-step process as covered in the pop-up window to create an analysis table.
-
Select the desired analysis tool from the drop-down (use the search function to quickly find tools). Optionally, configure the name for the table as well as the unique identifier key that will be used for each row in the table.
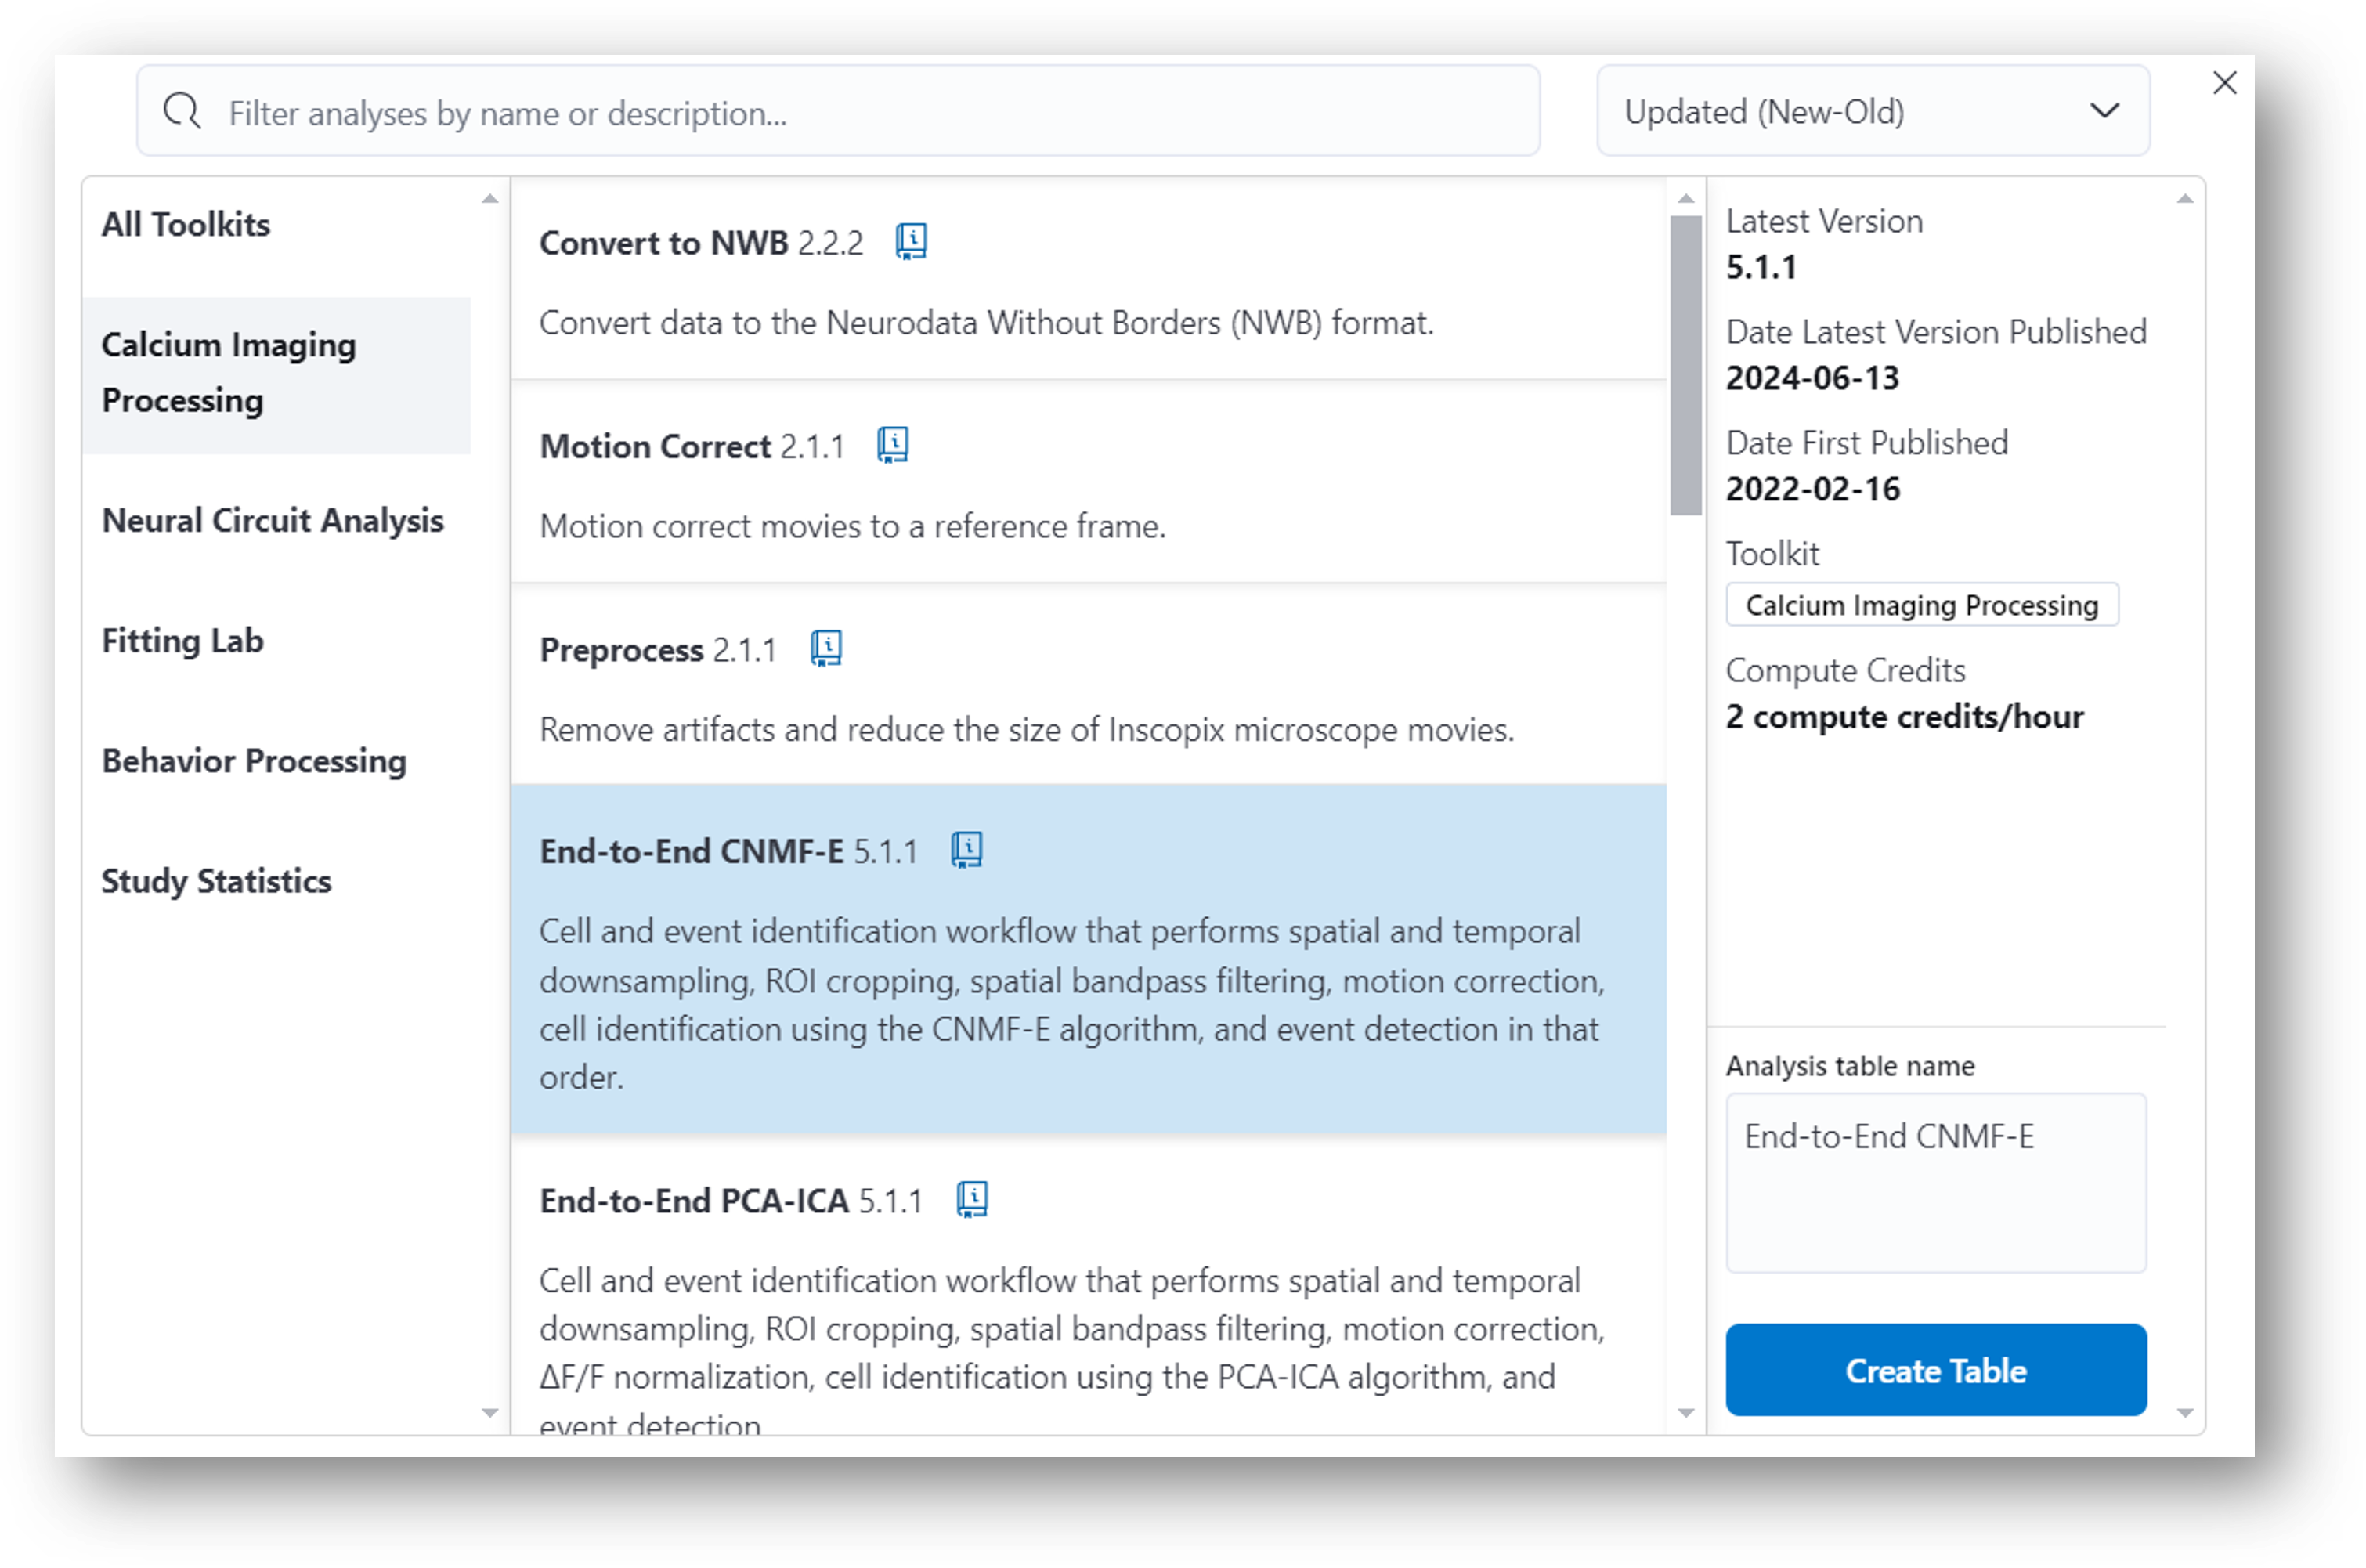
-
Map the analysis inputs and parameters. Select the source column containing the input file required for the analysis. Optionally, you may do the same for parameters used in the tool.
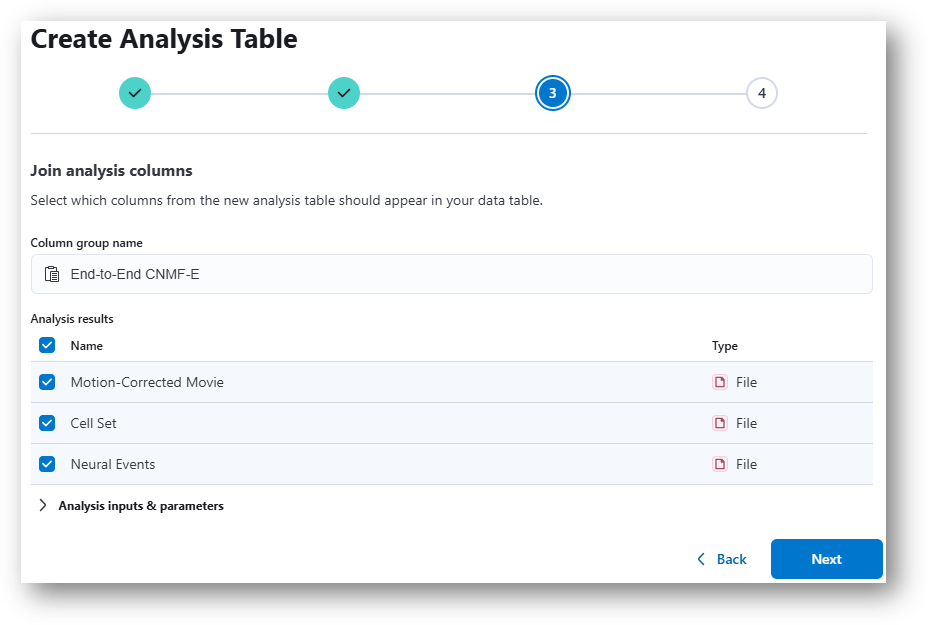
-
Join analysis columns. Select the analysis results you desire to join with your data table.
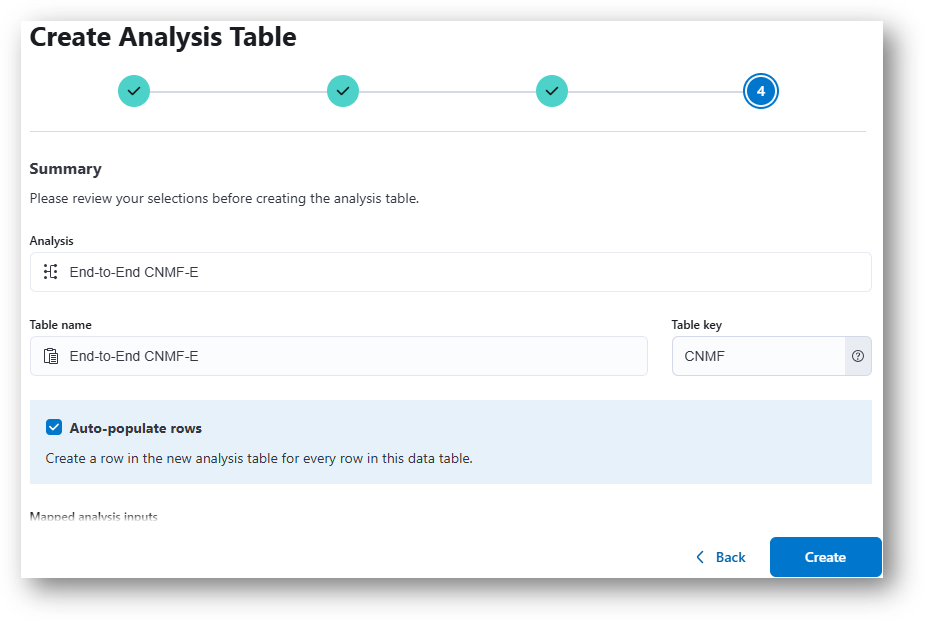
-
The last step is to review your selections and decide if you want the platform to auto-populate rows in the analysis table based on the rows in the data table. When you have confirmed your settings, click Create. You will automatically be taken to the analysis table.
Notes
- If you create an analysis table from the project home page, you will likely not see step 3 as IDEAS will not know what data table you want to use. Analysis results can be added to a data table after the analyses are complete.
- Using metadata as input parameters within a data table can be accomplished using one of two methods:
- Entire metadata values Add a metadata column to your data table. Create an analysis table and when mapping inputs and parameters, you will be able to select the metadata column from your data table as the source column. If a metadata column has not been created in the data table, you will not see an option to select from when mapping the inputs/parameters.
- Specific metadata values From an analysis table, click the link icon in the parameter cell and then select the specific metadatum you want to use. Note that after the task is run, the reference to the link will be lost (i.e., you will not be able to see that the input parameter was selected from the file metadata).
Run an analysis
Before executing the analysis, confirm the table is configured appropriately using the following recommendations. Note that if you created an analysis table from a data table, your table may already have all the appropriate rows and input movies. Please review the following notes in case you need to make any manual modifications.
-
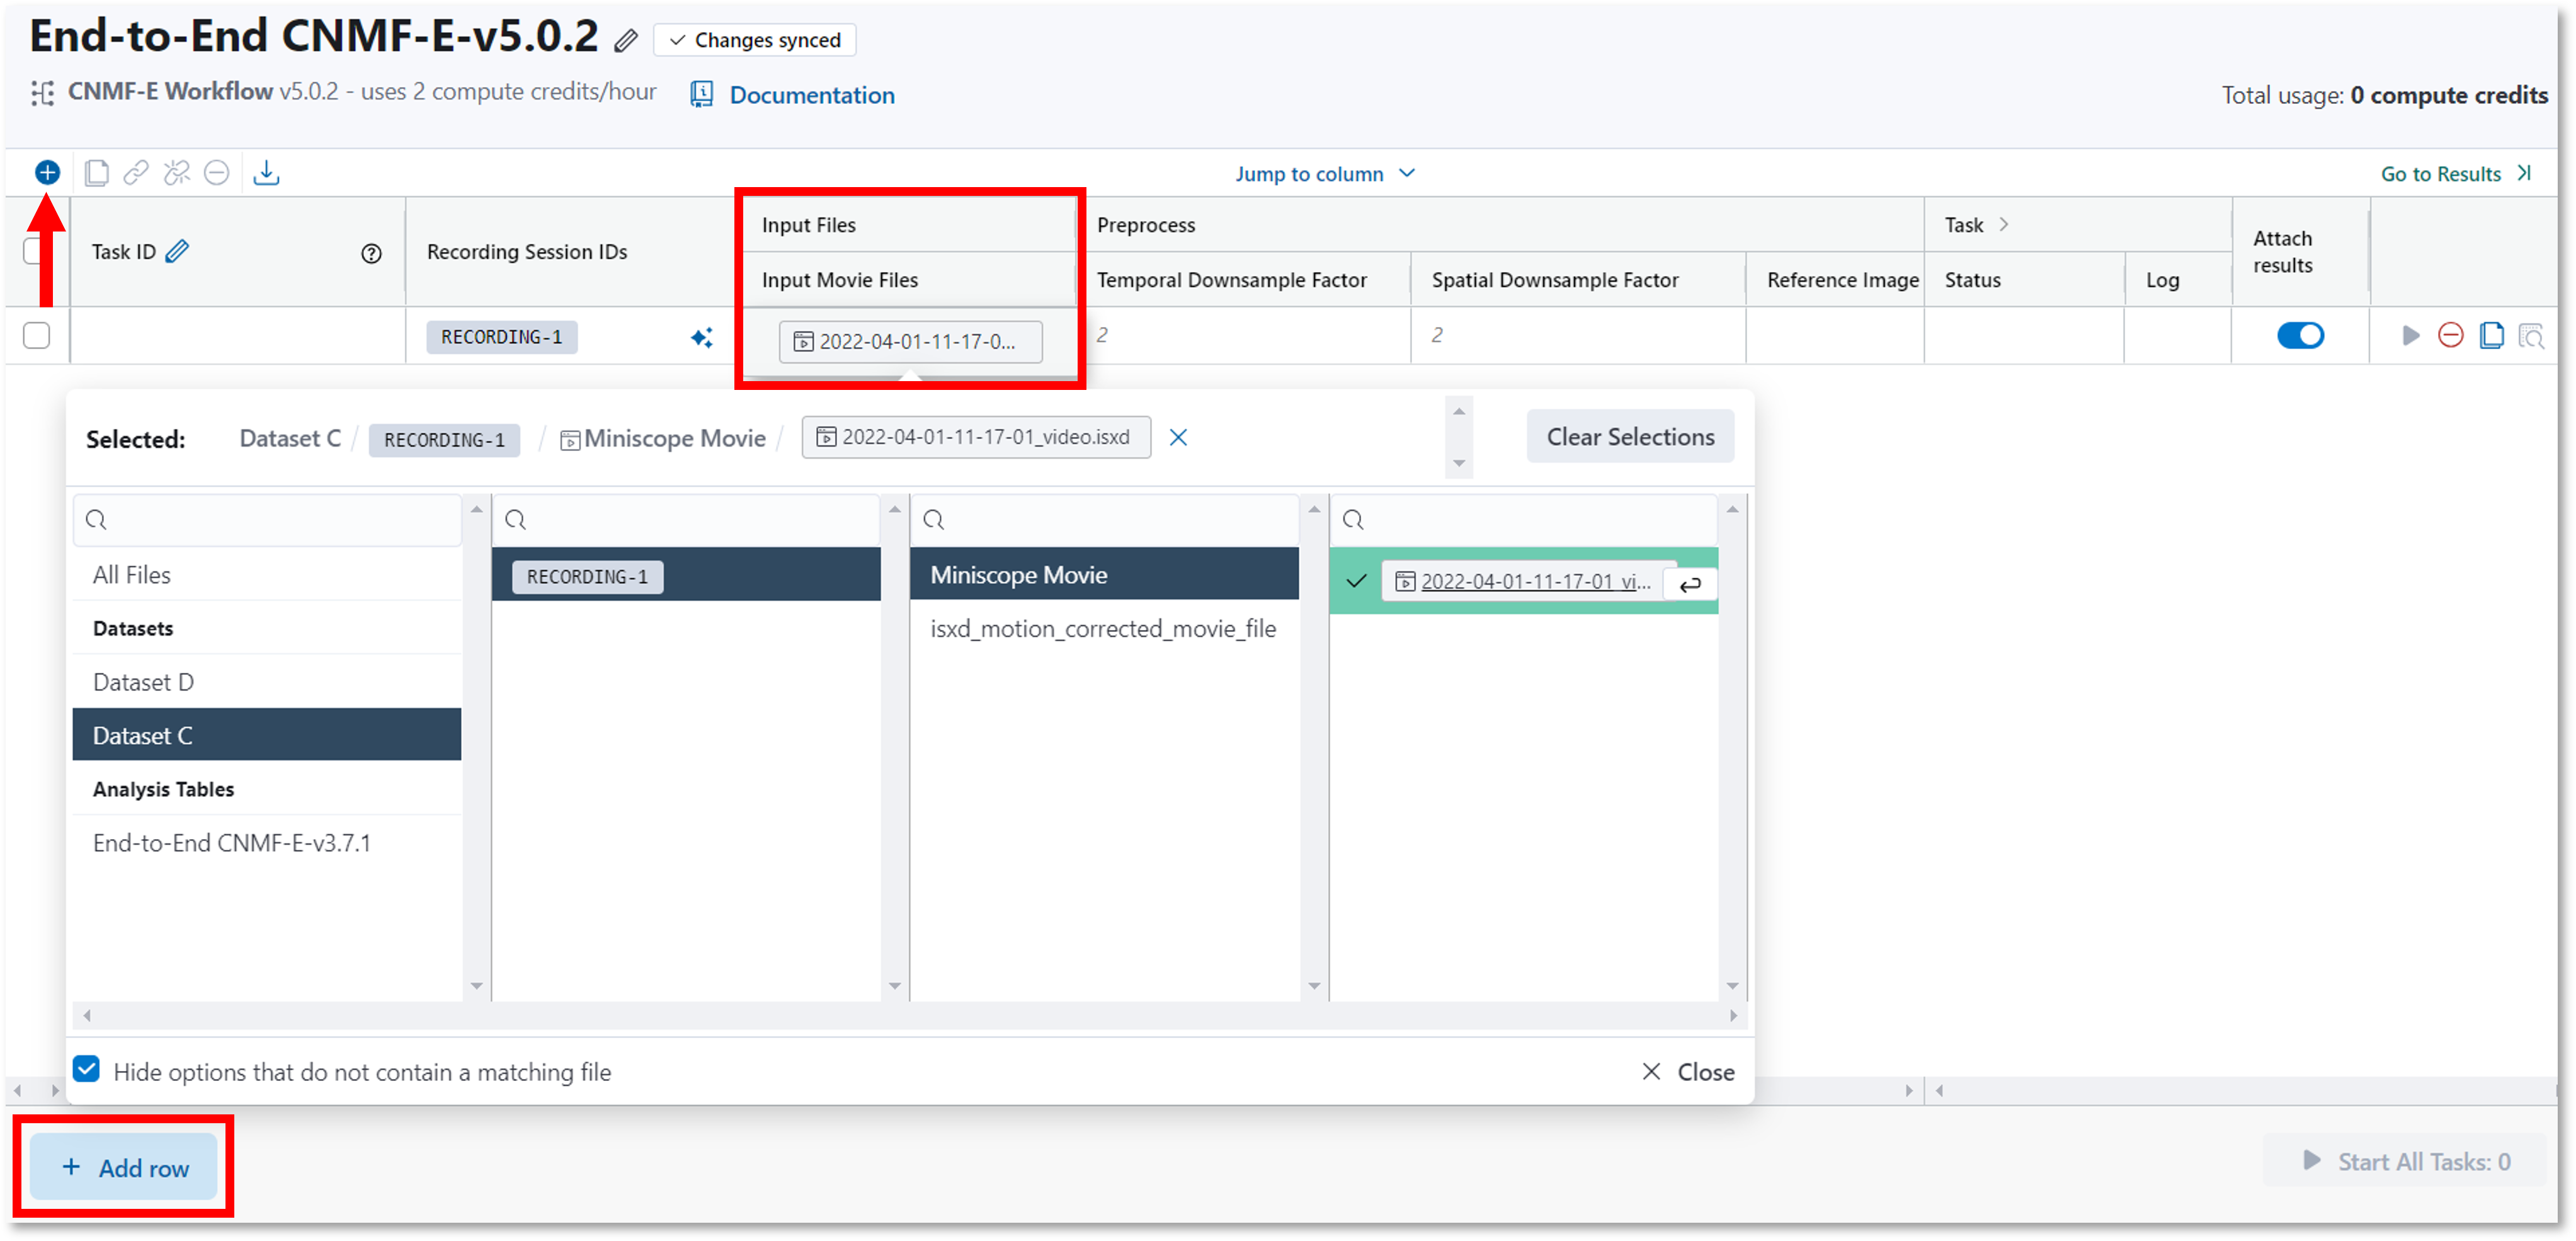
Add rows and input files.
Click the icon or Insert > Insert row(s) from the menu
to start adding data. Note that once you add a row, columns are auto-populated with default values. Double click the cell under Input Movie Files.
This will open a panel where you can select any compatible file from any data table or previously created analysis table from the current project.
Note that you may delete rows by clicking the
icon or Insert > Insert row(s) from the menu
to start adding data. Note that once you add a row, columns are auto-populated with default values. Double click the cell under Input Movie Files.
This will open a panel where you can select any compatible file from any data table or previously created analysis table from the current project.
Note that you may delete rows by clicking the  icon.
icon.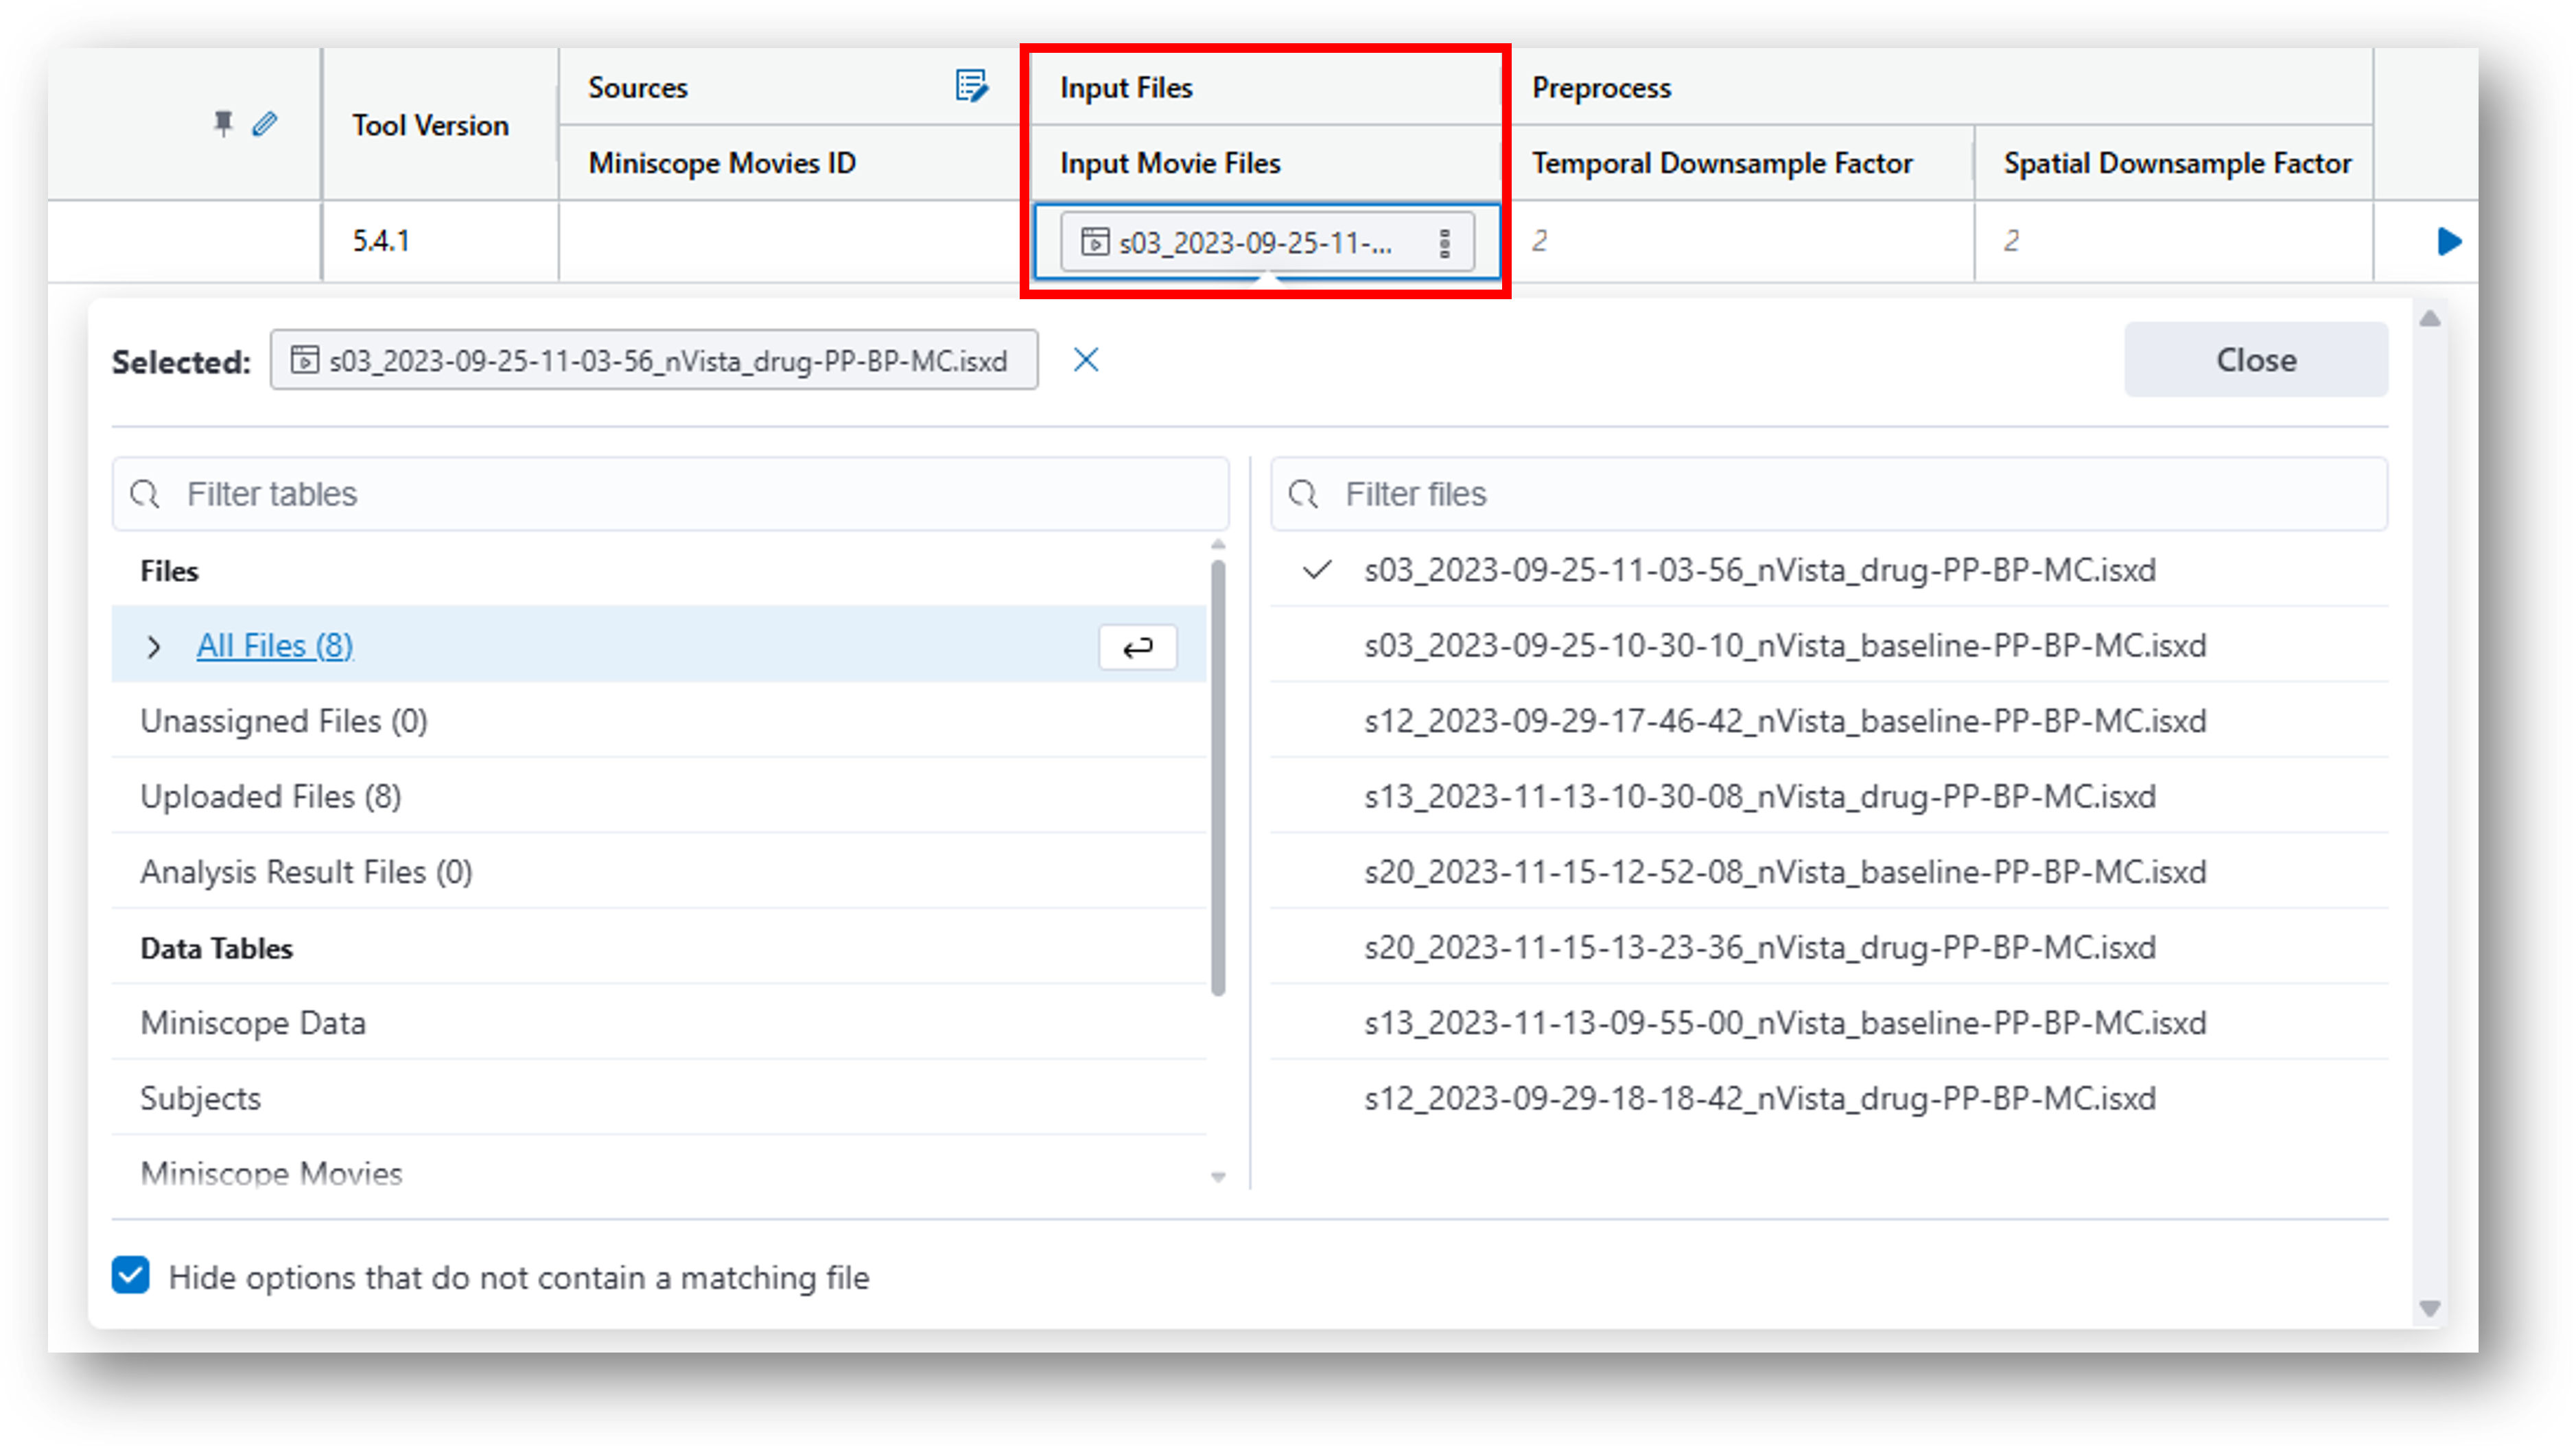
-
Complete the table by modifying parameters as desired.
Note the following:- Any cells highlighted in yellow must be filled in prior to continuing.
-
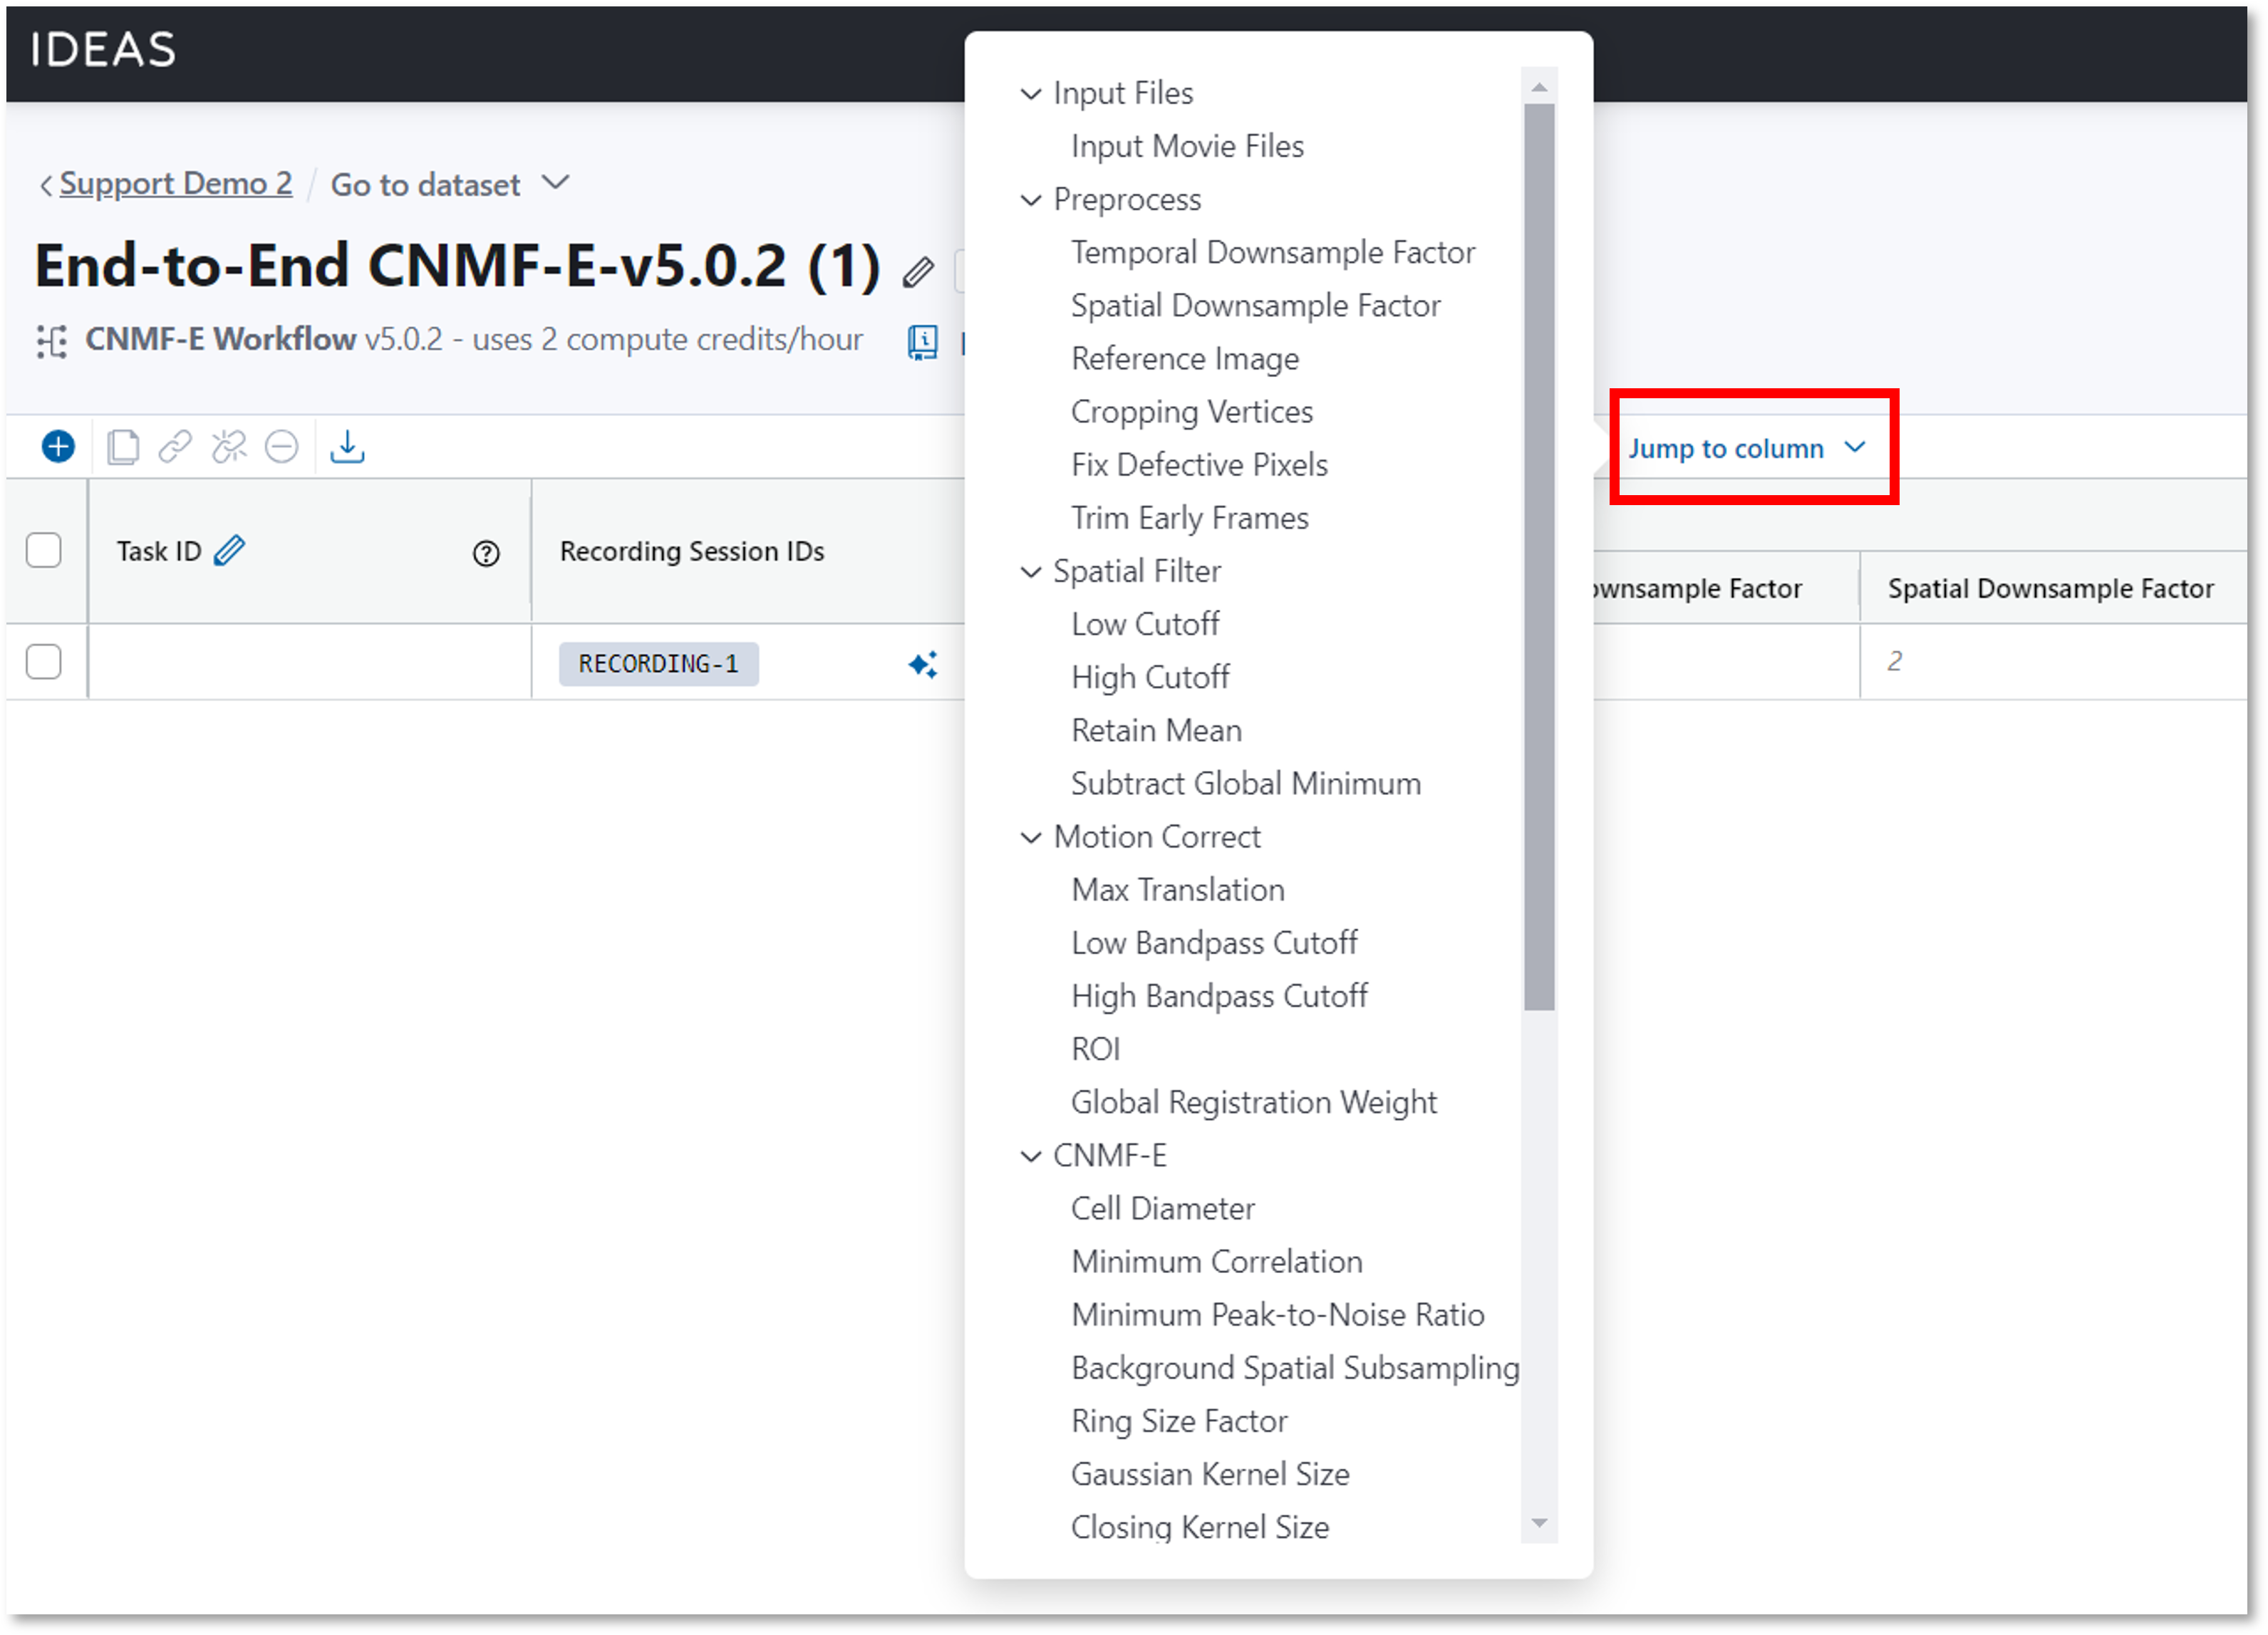
You can quickly navigate to a parameter using the Jump to column popup menu as shown below.
-
Some cells may have a
 icon when you hover over the cell indicating that you may fill the cell with information from the metadata.
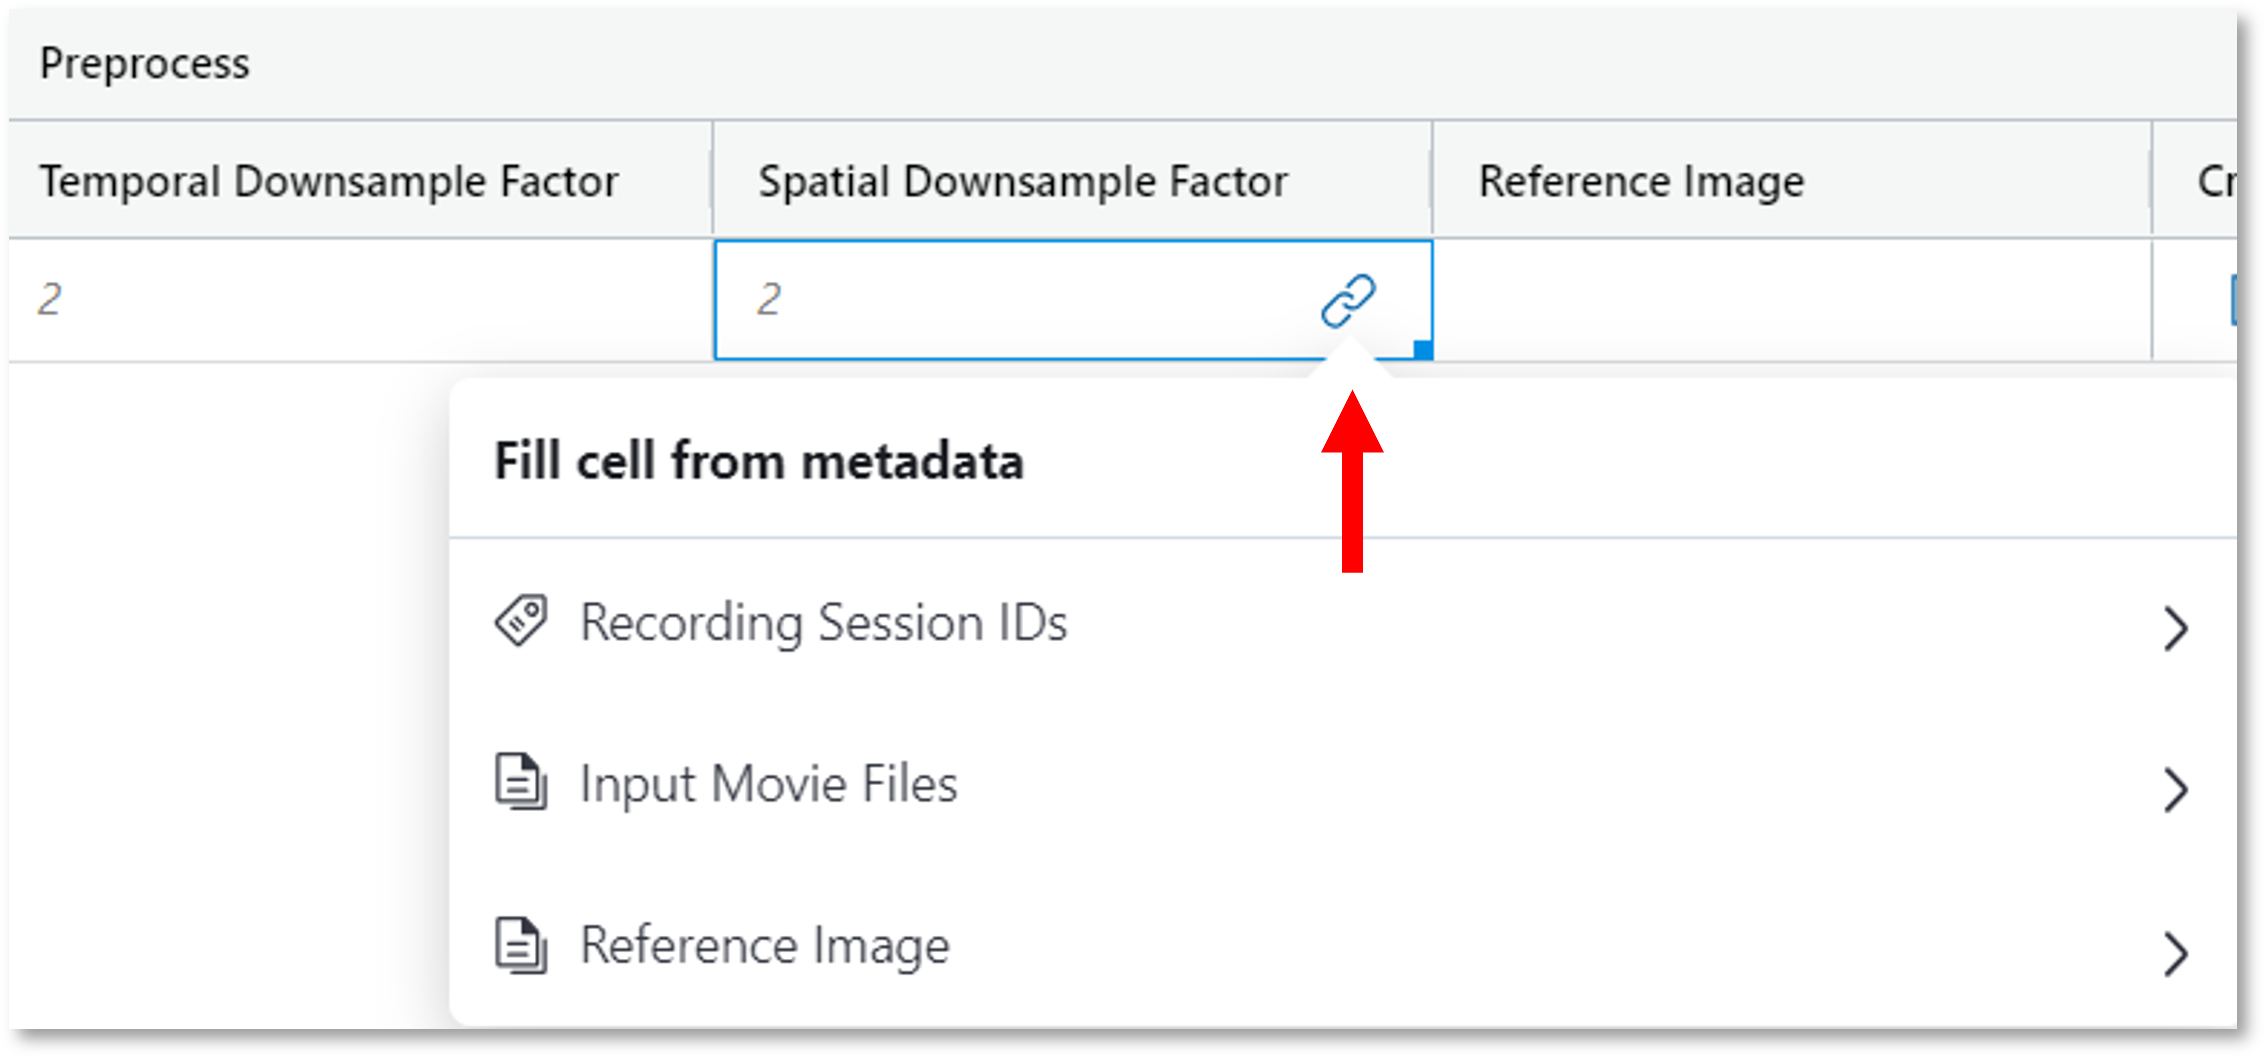
-
Configure your computing resources by navigating to the Compute Resources column and select the resources you want to use for the task. This allows you to tailor the resources more appropriately for smaller or larger input files. Take the following two examples:
- Example 1: If you want to run CNMFe on a small (2 GB) input movie, you can decrease the compute credit expenditure by reducing the default requirements (8 vCPUs, 64 GB RAM, 2 credits/hour) to (4 vCPUs, 8 GB RAM, 0.5 credits/hour).
- Example 2: If you want to run CNMFe on a large (100 GB) input movie, you can increase the compute requirements to accommodate (up to 256 GB of RAM is offered).

-
Duplicate a row by clicking the Copy row
 icon.
This may be useful if you want to run the same analysis using a range of different parameters to find the condition most optimal for your data.
icon.
This may be useful if you want to run the same analysis using a range of different parameters to find the condition most optimal for your data.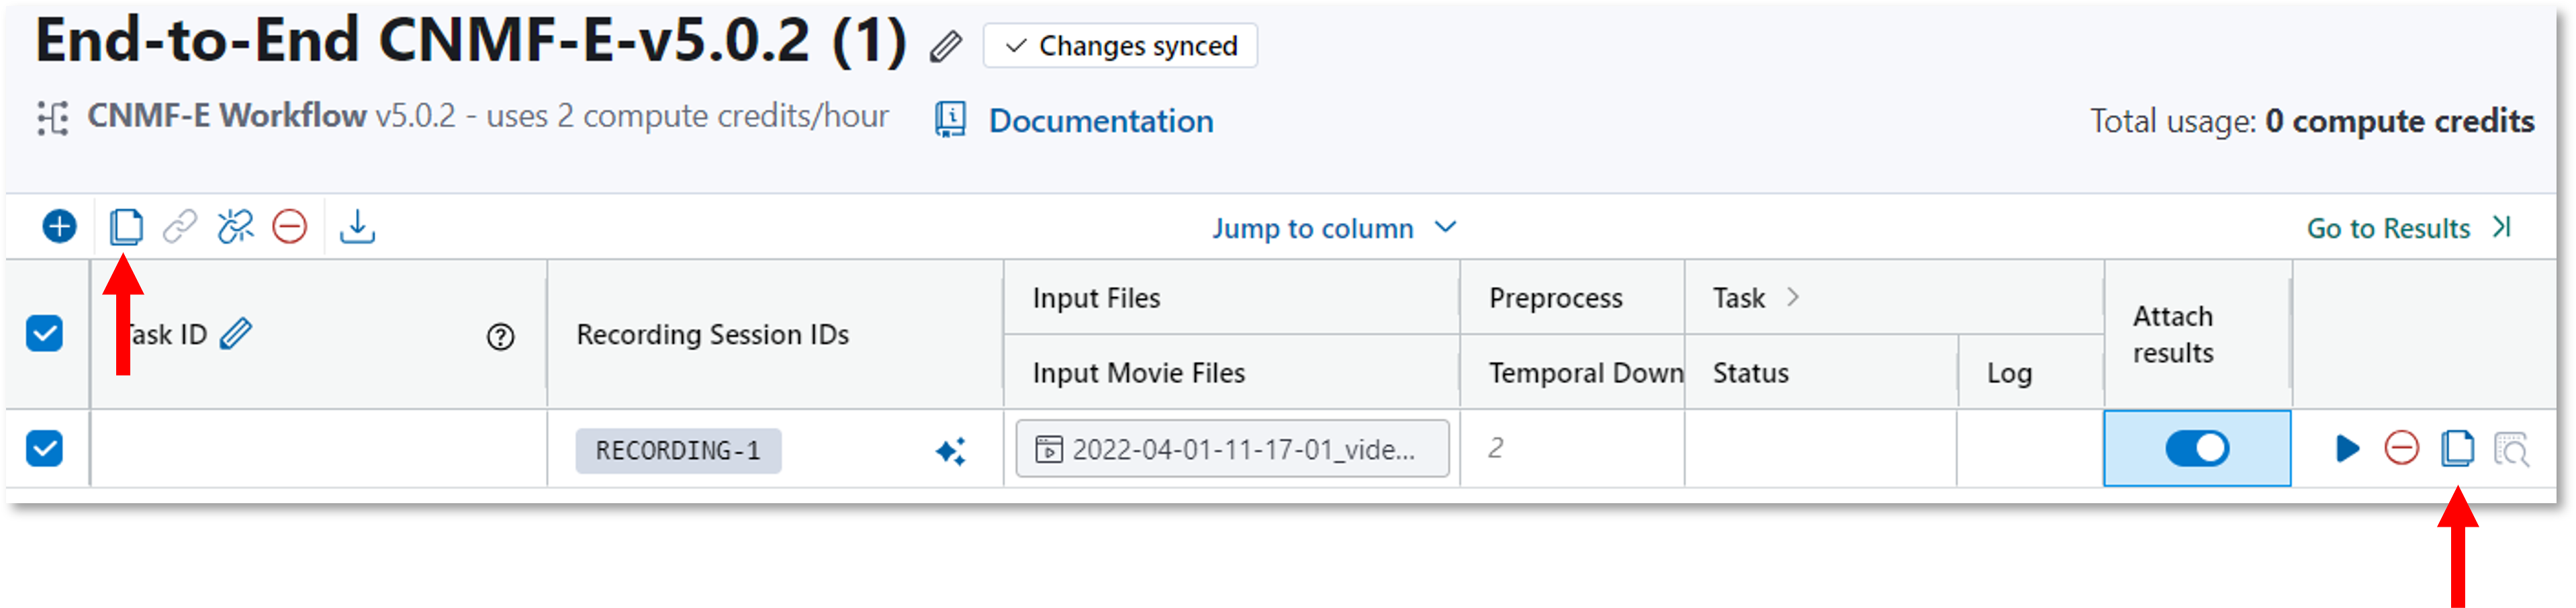
After finalizing the settings for your table, click Start All Tasks or the  icon to begin the analysis. The number next to the button represents how many tasks will be executed.
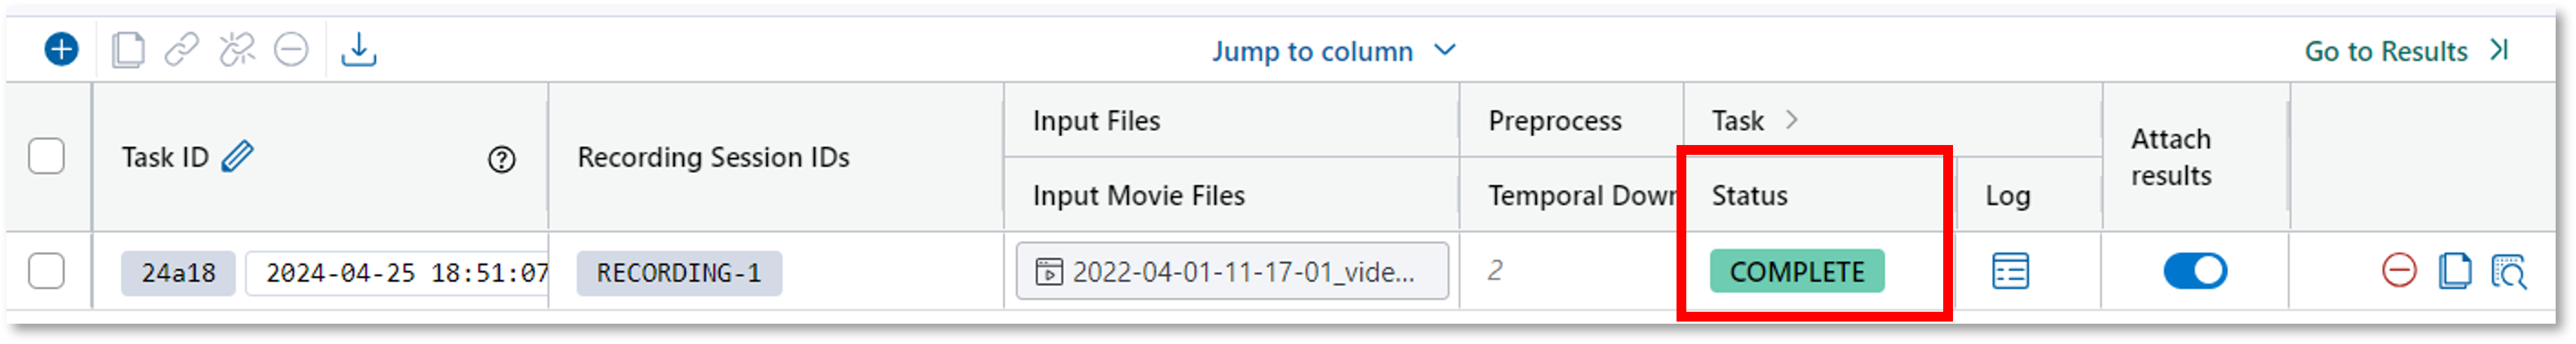
Once the task is initiated, the following status options will appear in the last column (in order of task completion):
icon to begin the analysis. The number next to the button represents how many tasks will be executed.
Once the task is initiated, the following status options will appear in the last column (in order of task completion):
 Queued
 Initializing
 Running
 Complete
Error Status
If an error is encountered, the status will change to Failed.
- Navigate to the File menu to download the analysis table to a .csv file.
Task info and results
Information related to an analysis task can be found in the analysis table by clicking the Go to Task Info link.

You can view all tasks for the project by navigating to the Tasks tab from the project home page.

The Tasks table lists all tasks executed or in progress including the date the task was run, user who executed the task, status, run-time duration, and compute credits consumed. You can click on the source link to navigate directly to the respective analysis table. The bottom of the table provides a summation of all compute credits consumed across all tasks.
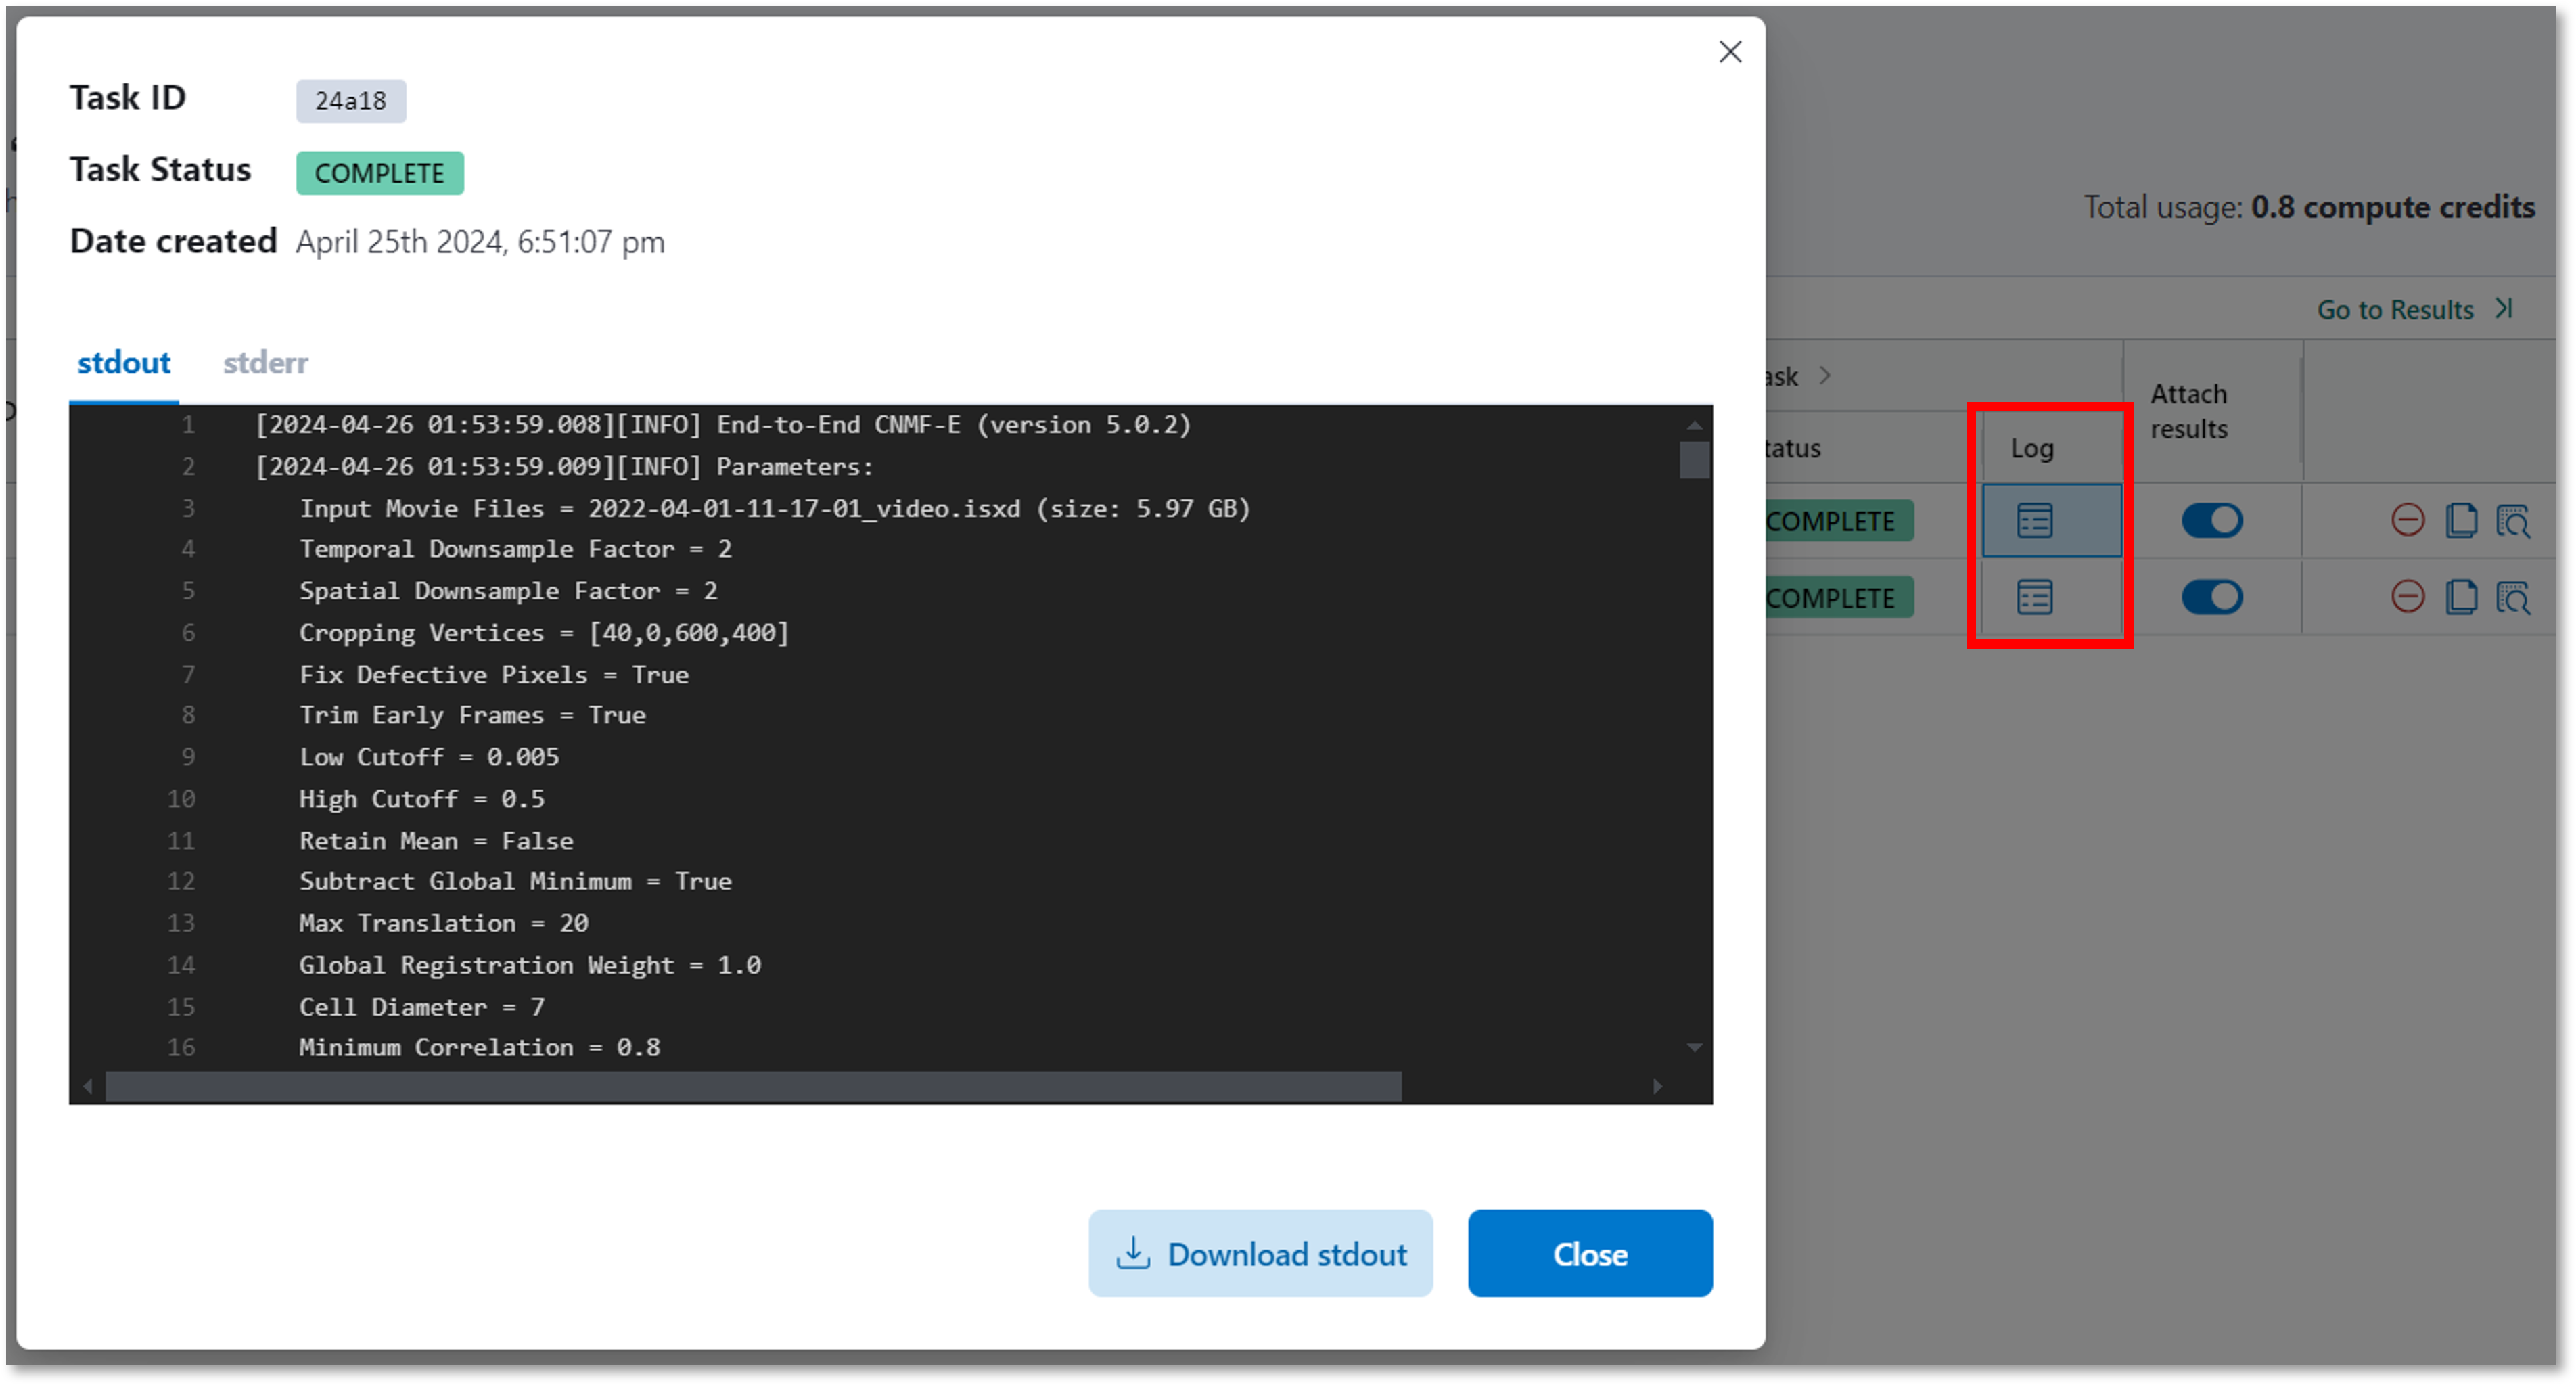
Inspect task logs
If you click the task Log icon in the analysis table, a window pops open allowing you to view the task logs and the resource usage. The logs may be useful when an error is encountered when running an analysis. Click the download button to download the logs. These logs may be shared with Support when you encounter errors.
Click the Resource Usage tab to view a table tracking the compute resources consumed. You will find min and max usage for CPU, RAM, and storage, as well as percentage used of what has been allocated. Use this table to guide selecting the appropriate resources when executing future tasks.

Preview results
From the analysis table, click Go to Results which will take you to the Analysis Results columns.
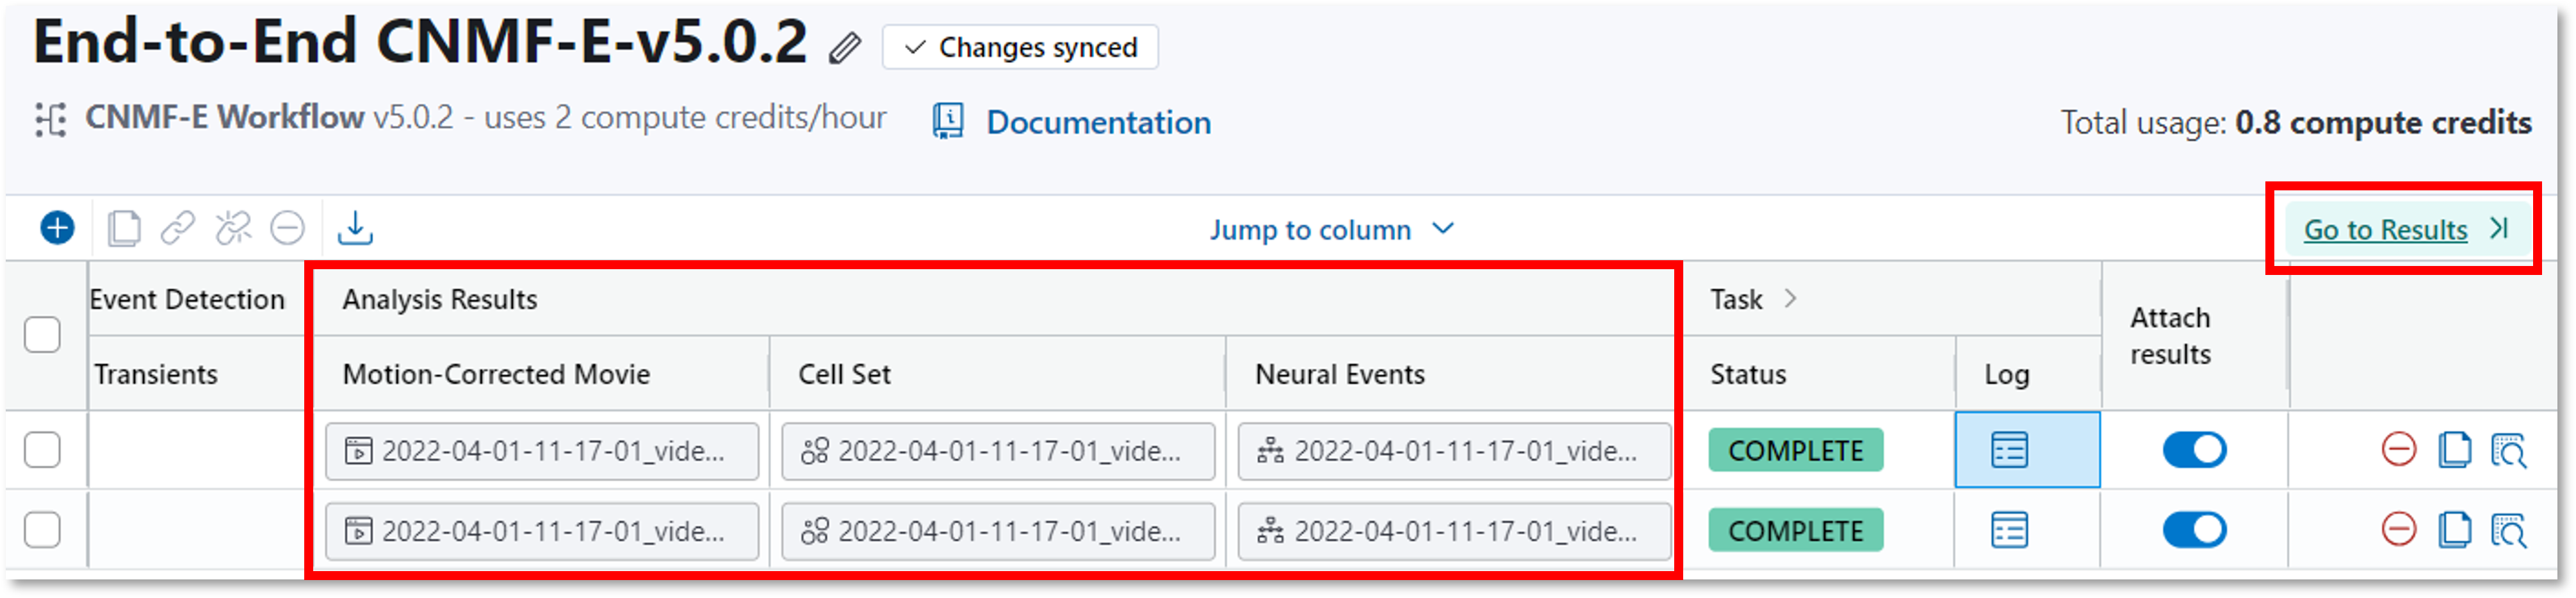
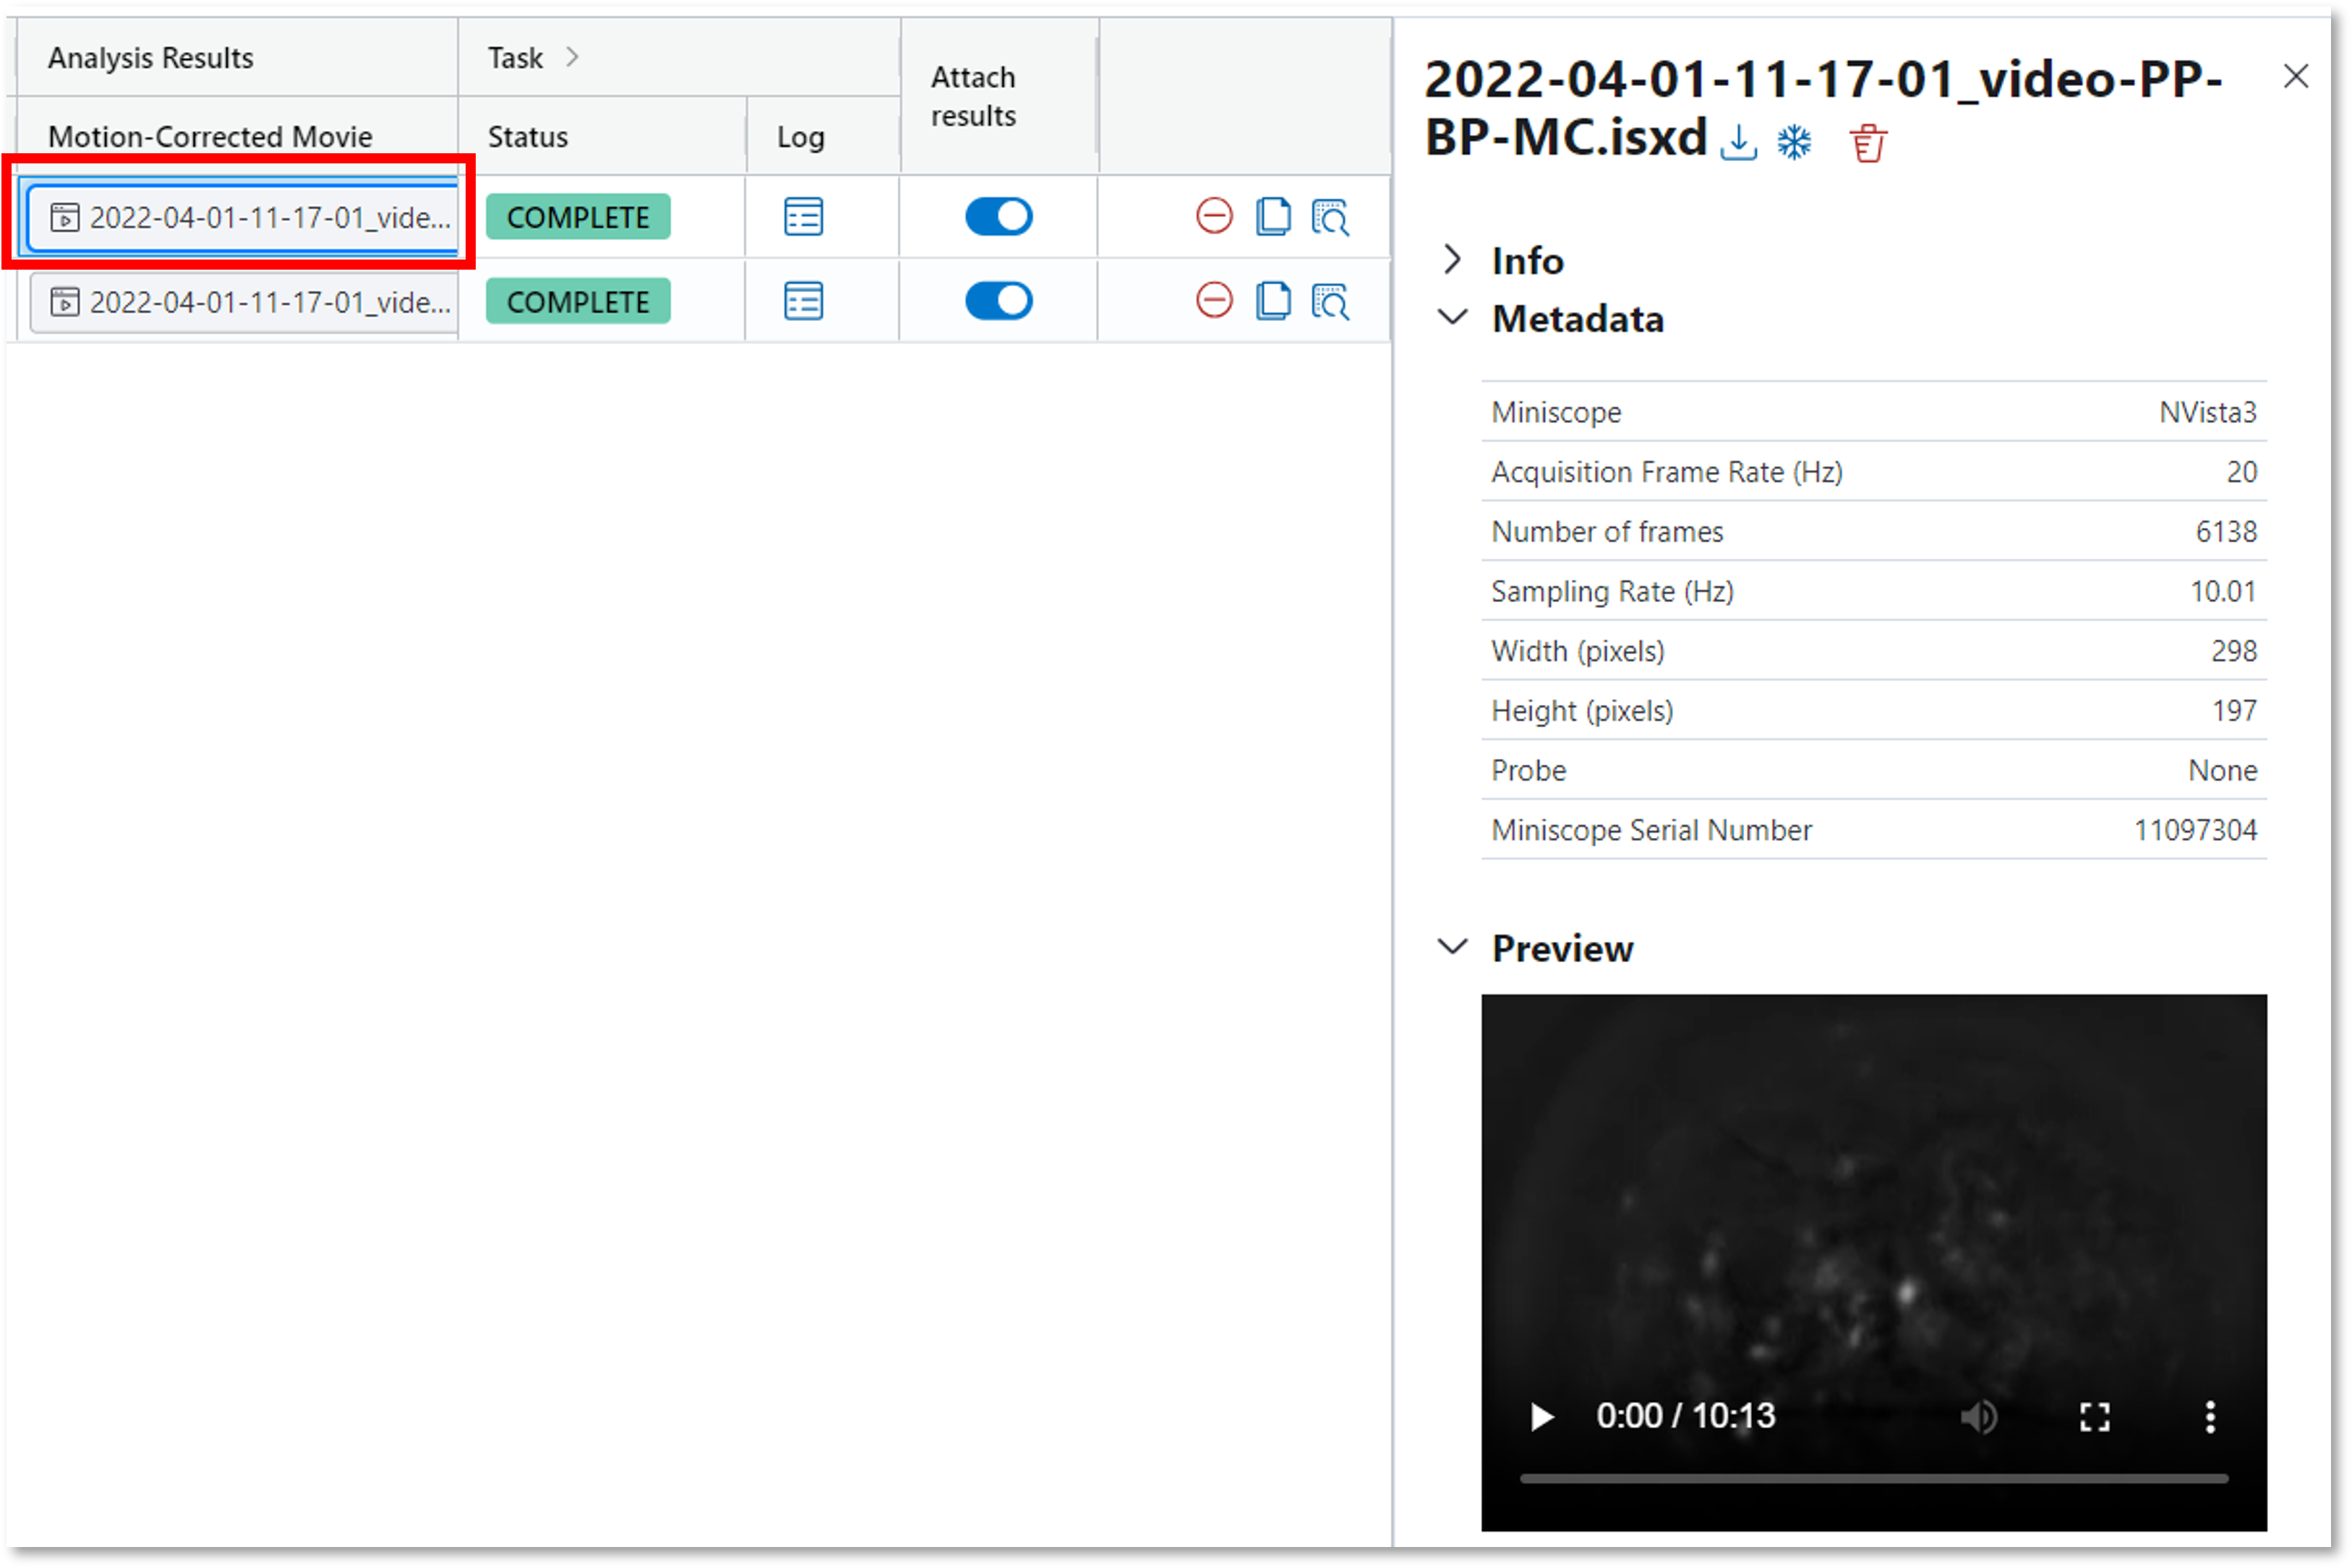
Click any file to preview.
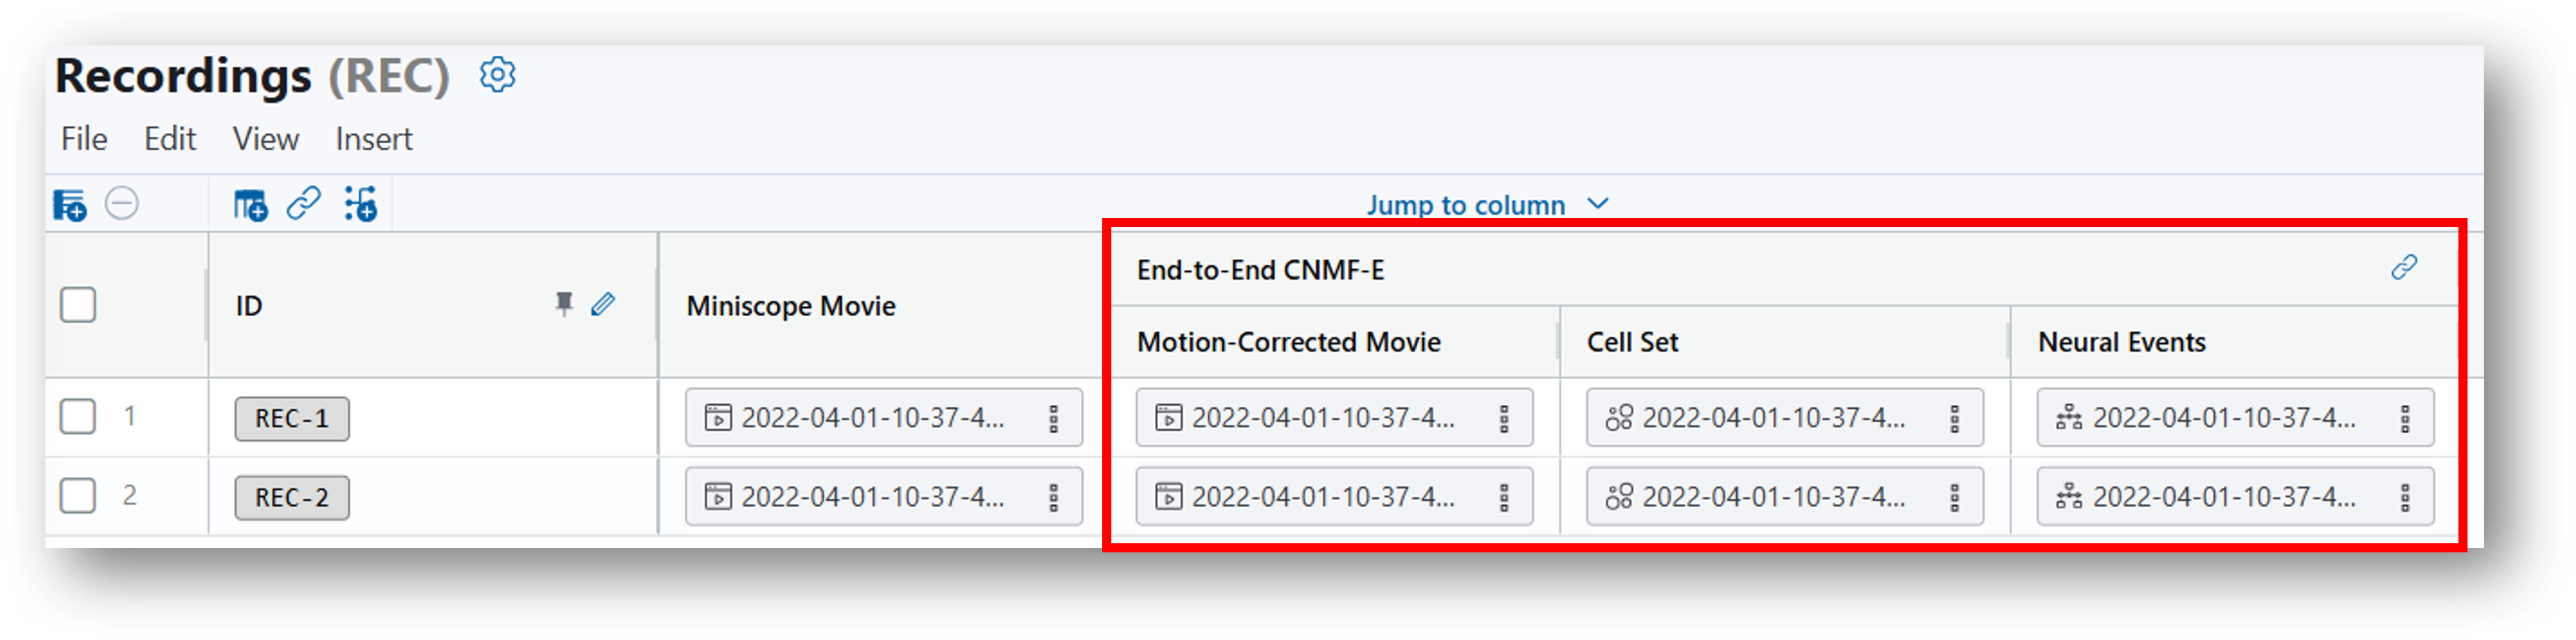
Organize results with data
As mentioned above, if the analysis table was created so that it was already joined to a data table, the analysis results will automatically be appended to the data table as shown in the example below. Otherwise, results can be associated with a data table using the Joining Tables feature.
Tool versions
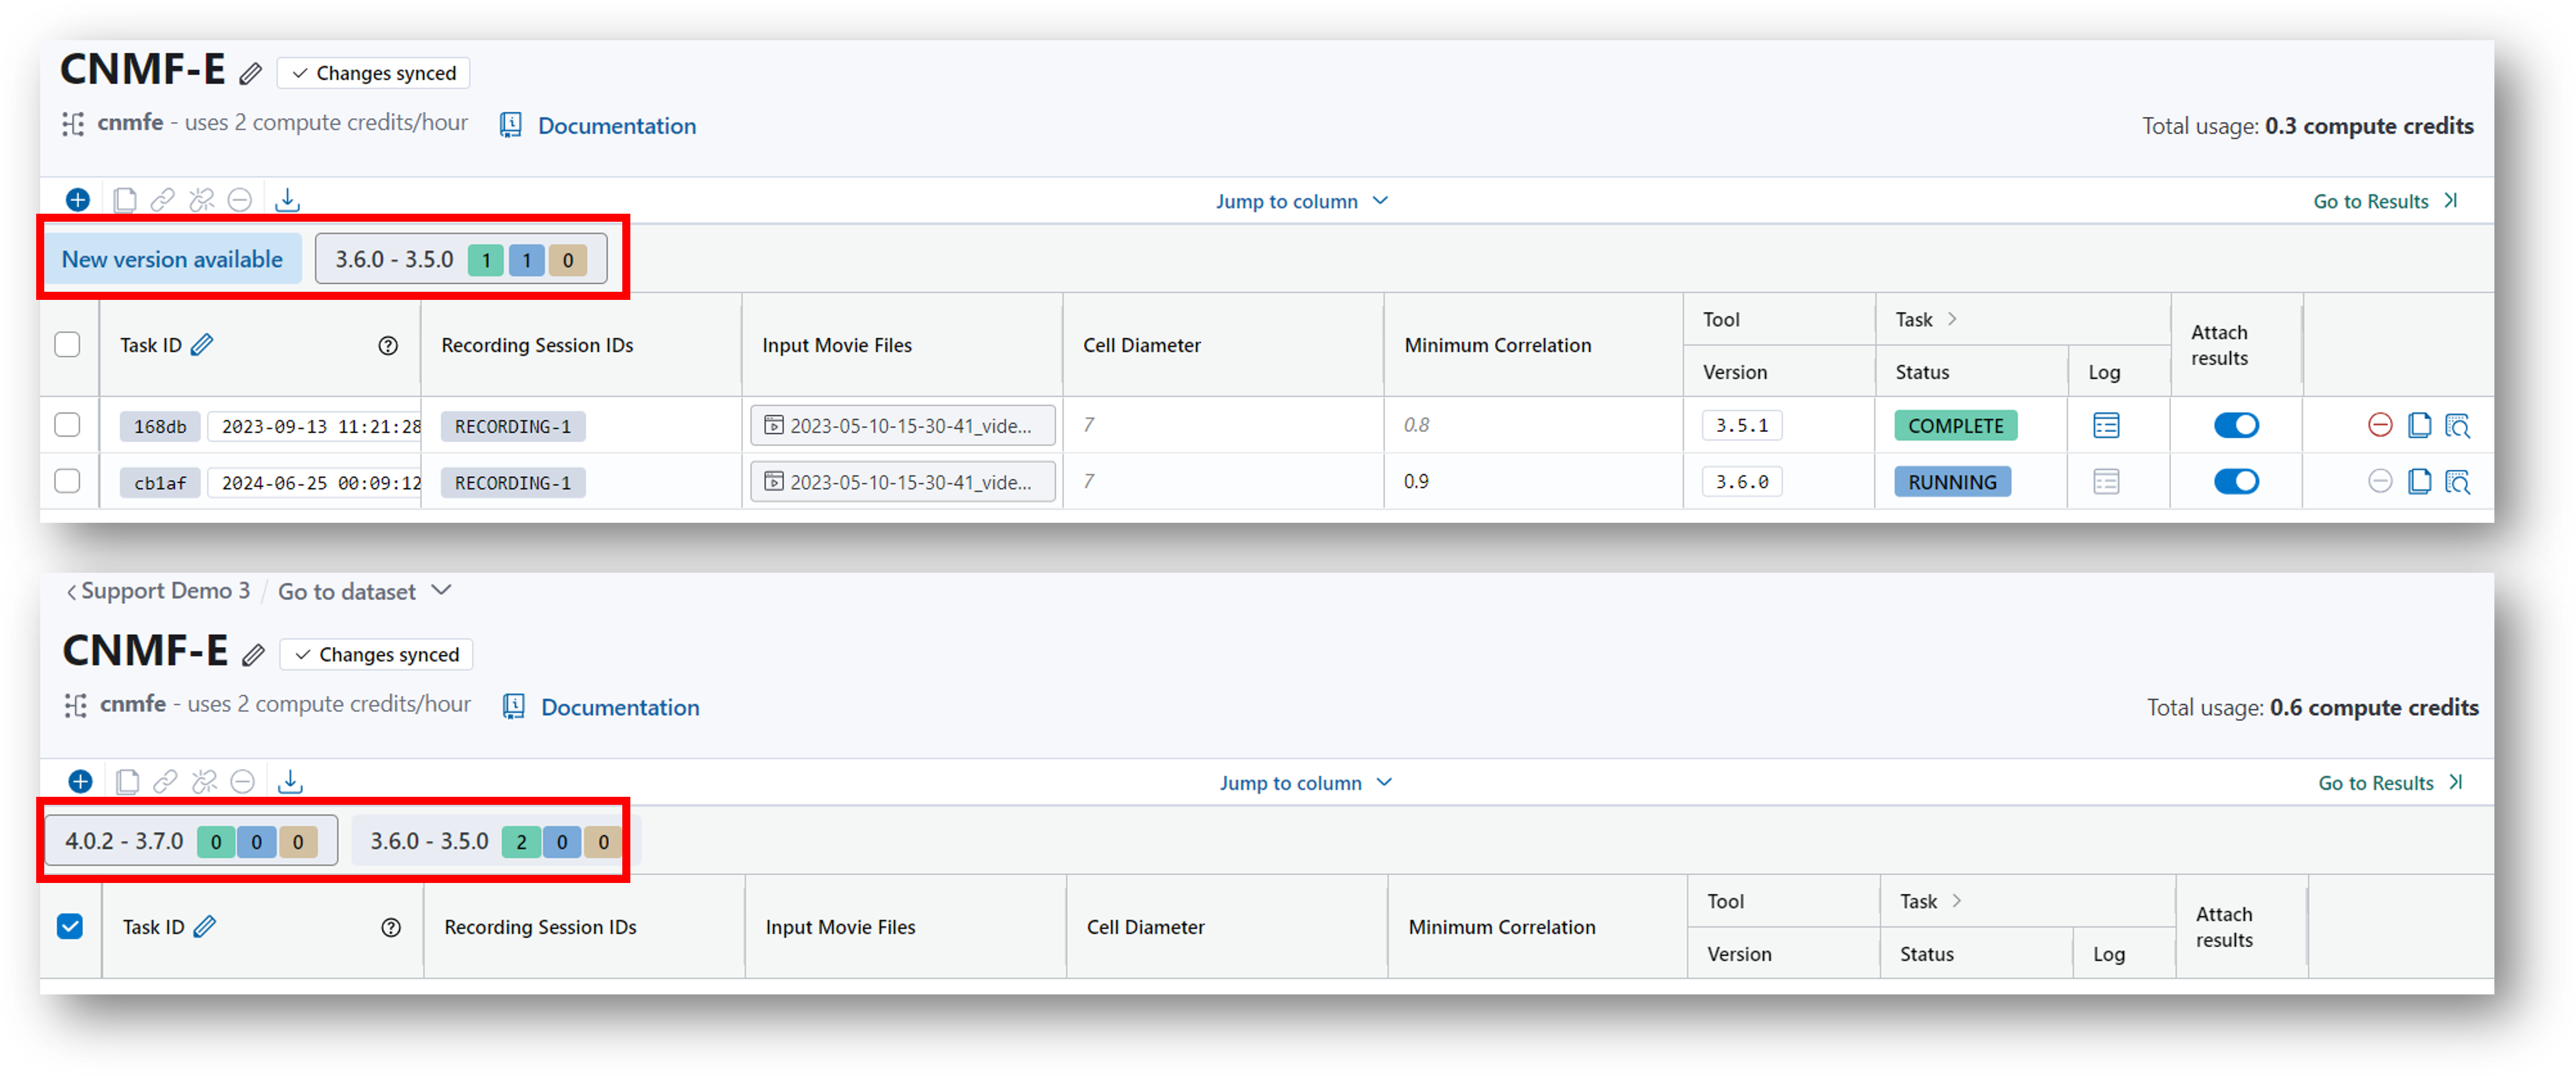
When new features are added or bugs are fixed for an analysis tool, a new version is released. You can view what tool version was used when running a task by looking at the Tool Version column within the Analysis Table as shown below.
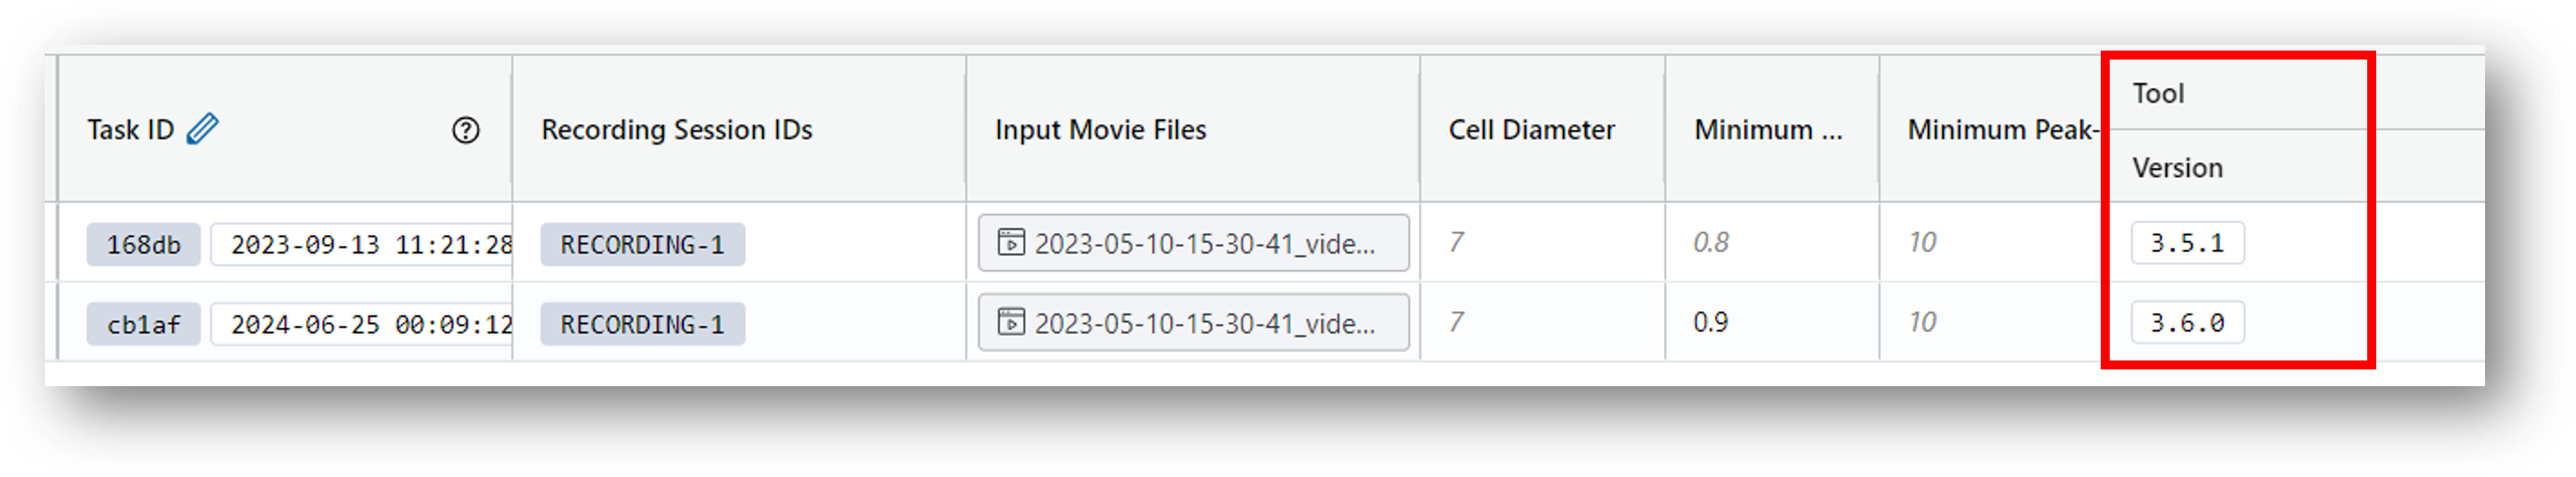
Changes to a tool can be minor (e.g., changing the axis label of an output data preview) or major (e.g., changing the parameters that the user can modify or modifying the underlying logic of the analysis method).
IDEAS groups tool versions into tabs on the analysis table based on the following change types:
-
Minor Change
- there is no change to the format of the analysis table (i.e., no new or removed parameters or outputs)
- the changes are not meaningfully different enough to warrant creating a new version tab
-
Major Change
- there is a change to the format of the analysis table (i.e., a column has been added or removed)
- the changes are meaningfully different enough to warrant creating a new version tab
For example, a task with version 3.7.1 compared to 3.9.0 represents a minor change, but compared to v5.3.0 it would be a major change.
Note
Tool authors decide how to group versions in tabs per their discretion.
When running tasks, note the following:
-
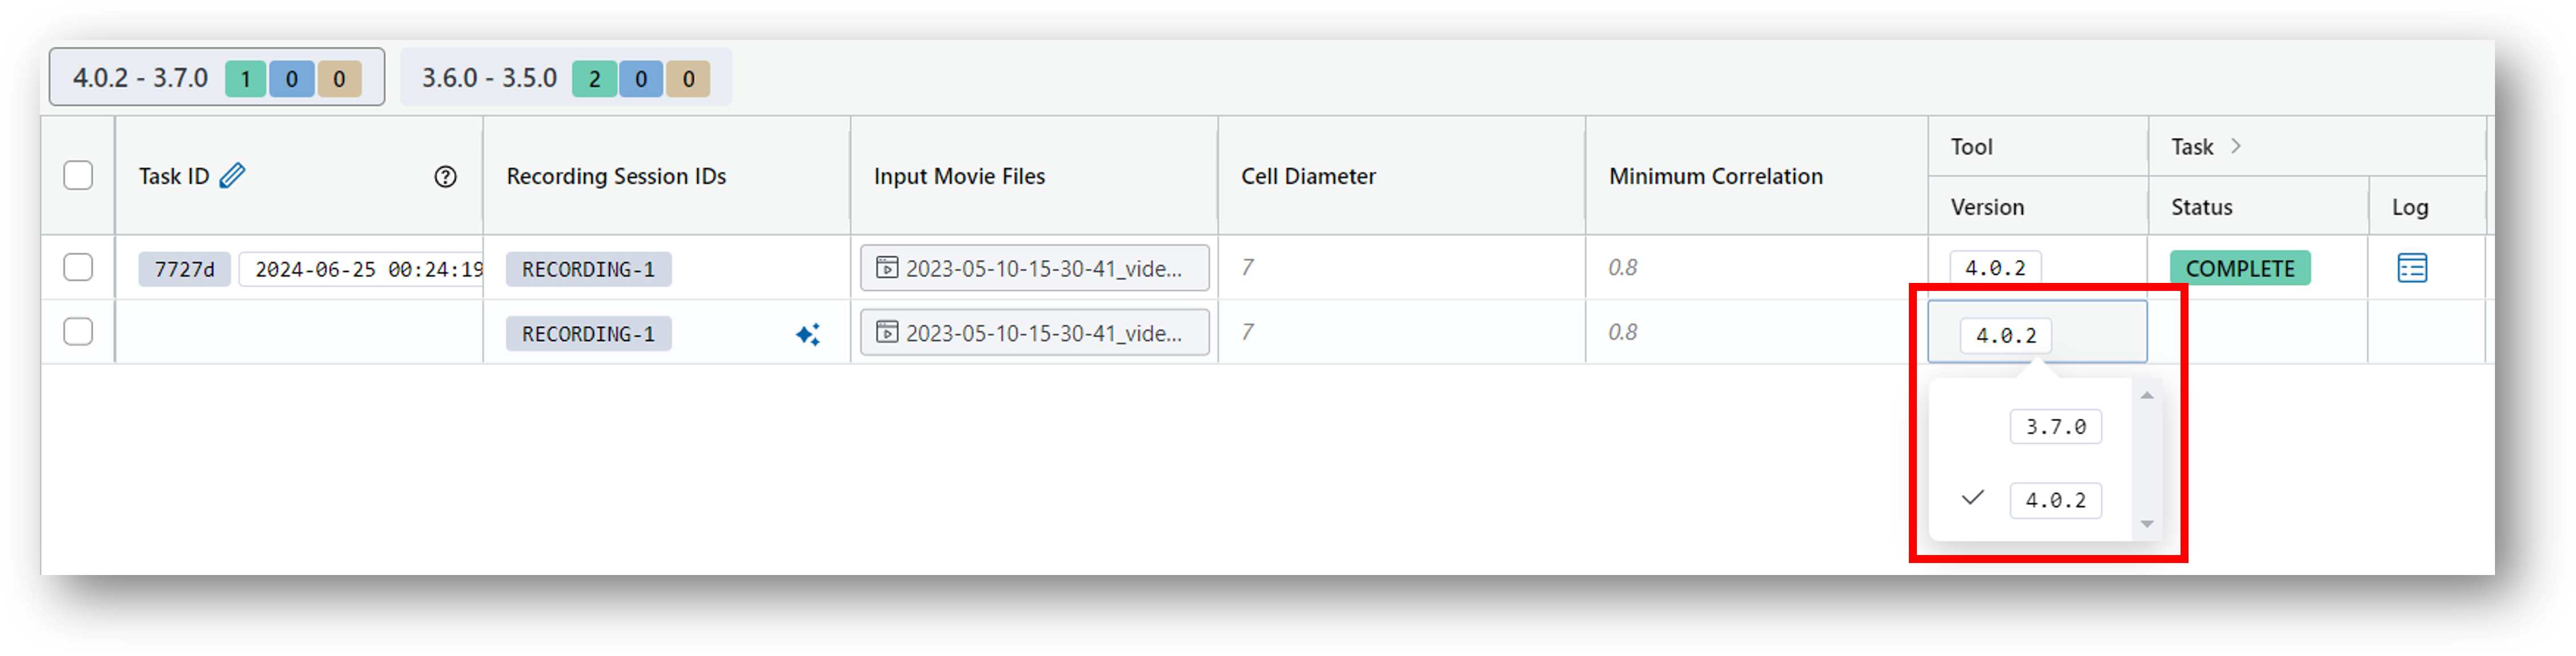
Different minor versions can be run on the same analysis table.
Select which minor version you want to execute when running the task from the Tool Version column as shown below. By default, the latest version will be used.
-
Different major versions must be run on separate analysis tables.
When a new major version is released, there will be an option to create a new analysis table with the new major version.