Peri-Event Analysis Workflow
This tool uses 1.0 compute credits per hour.
Overview
The peri-event analysis workflow quantifies how neural signals vary before and after event timestamps. Specifically, this analysis computes the change in neural activity of both the entire population of neurons and each individual neuron, classifying them into up-modulated, down-modulated, or non-modulated sub-populations.
We calculate the peri-event change in activity (Δ activity) by taking the difference between the post-event and pre-event activity, and compare it to a null distribution generated by circularly permuting the event times relative to the neural time series. This comparison is non-parametric and makes few assumptions about the underlying distributions of neural activity or events.
Peri-event analysis is a broadly applicable workflow, and has been extensively used in the field of systems neuroscience for the analysis of signals at the sensory1 2, cognitive3 4 5 6 and motor research7 8 9.
Input Files
To run the peri-event analysis workflow, users muse have a Cellset and a corresponding Events file.
The Cellsetinput contains time series traces for each cell in the field-of-view of the recording along with the
corresponding footprints.
An Events file contains information about when events occurred. Note that each event in this
context refers to a single time event point.
Event files supported by this tool can be generated using Convert CSV File to Events or Detect Events from GPIO Data.
| Source Parameter | File Type | File Format |
|---|---|---|
| Input cell sets | cell_set | isxd |
| Input events | events | h5 |
Parameters
| Parameter | Required? | Default | Description |
|---|---|---|---|
| Input cell sets | True | N/A | Select cell sets to use for analysis |
| Input events | True | N/A | Select event data to use for analysis |
| Event type | True | N/A | Select type of event to analyze from the column names of the event file |
| Statistical window (pre, start) | True | -1 | Start of time window in seconds before each event to use for statistical tests |
| Statistical window (pre, end) | True | 0 | End of time window in seconds before each event to use for statistical tests |
| Statistical window (post, start) | True | 0 | Start of time window in seconds after each event to use for statistical tests |
| Statistical window (post, end) | True | 1 | End of time window in seconds after each event to use for statistical tests |
| Number of random shuffles | True | 1000 | Number of random shuffles of event times to perform for constructing null distribution |
| Significance threshold | True | 0.05 | p-value threshold for classifying neurons as up- or down-modulated |
| Seed | True | 0 | Seed for the random generator used to shuffle event indices |
| Visual window (pre) | True | -2 | Time in seconds to visualize before each event in output figures (not used for statistics) |
| Visual window (post) | True | 2 | Time in seconds to visualize after each event in output graphs (not used for statistics) |
| Population activity (y-axis range) | False | auto | y-axis range (z-score) applied to the event-aligned population activity plot specified as 'min,max' (e.g. -1,1) or 'auto' |
| Activity heatmap (colormap range) | False | auto | colormap range (z-score) applied to the activity heatmap specified as 'min,max' (e.g. -1,1) or 'auto' |
| Activity by modulation group (y-axis range) | False | auto | y-axis range (z-score) applied to the event-aligned activity by modulation plot specified as 'min,max' (e.g. -1,1) or 'auto' |
Tip
-
To quickly view and navigate between parameters, select the ‘Jump to Parameter’ button at the bottom of the page.
-
Hover the mouse over the column name to get a short description of the parameter.
Algorithm Description
The workflow is summarized using a flowchart below.
The workflow processes each event type independently. For each event type, the neural activity is first z-scored (performed individually for each neuron), and then the Δ activity is computed at two levels: population level and single-cell level. The Δ activity of all neurons is plotted as a heat-map (Panel A), and the true population average activity is plotted against the null distribution (Panel B).
At both population and single cell level, modulation is determined by comparing the Δ activity to a null-distribution constructed by randomly circularly permuting the event times relative to the neural time series. This process is repeated a number of times based on the Number of random shuffles parameter. Next, we calculate the bootstrap probability by finding both the fraction of the null distribution that is greater than the true Δ activity, and the fraction of the null distribution that is less than the true Δ activity. As a result the precision of the p-value is directly correlated to the size of the null distribution, defined by the number of random shuffles. For example, if the null distribution is created by 1000 random shuffles, the resolution of the p-value will be 0.001. This means that the smallest p-value greater than 0 that can be obtained is 0.001, if there are no values in the null distribution that are smaller than the true Δ activity, the p-value will be 0.
We then compare the p-value to our significance threshold α. Because we are performing a two-tailed test, we compare the p-value to α/2 on each side of the distribution. Specifically, populations/cells will be labeled as up-modulated if the bootstrap probability is less than α/2, down-modulated if the bootstrap probability is greater than 1-α/2, and non-modulated if the bootstrap probability is between α/2 and 1-α/2.
After each individual cell has been classified, they are grouped into up-modulated, down-modulated, and non-modulated subpopulations. The average activity of each subpopulation is plotted (Panel C). The spatial locations of the modulated cells are also plotted (Panel D).
Output figures
Panel A: Event-Aligned single cell activity heatmap
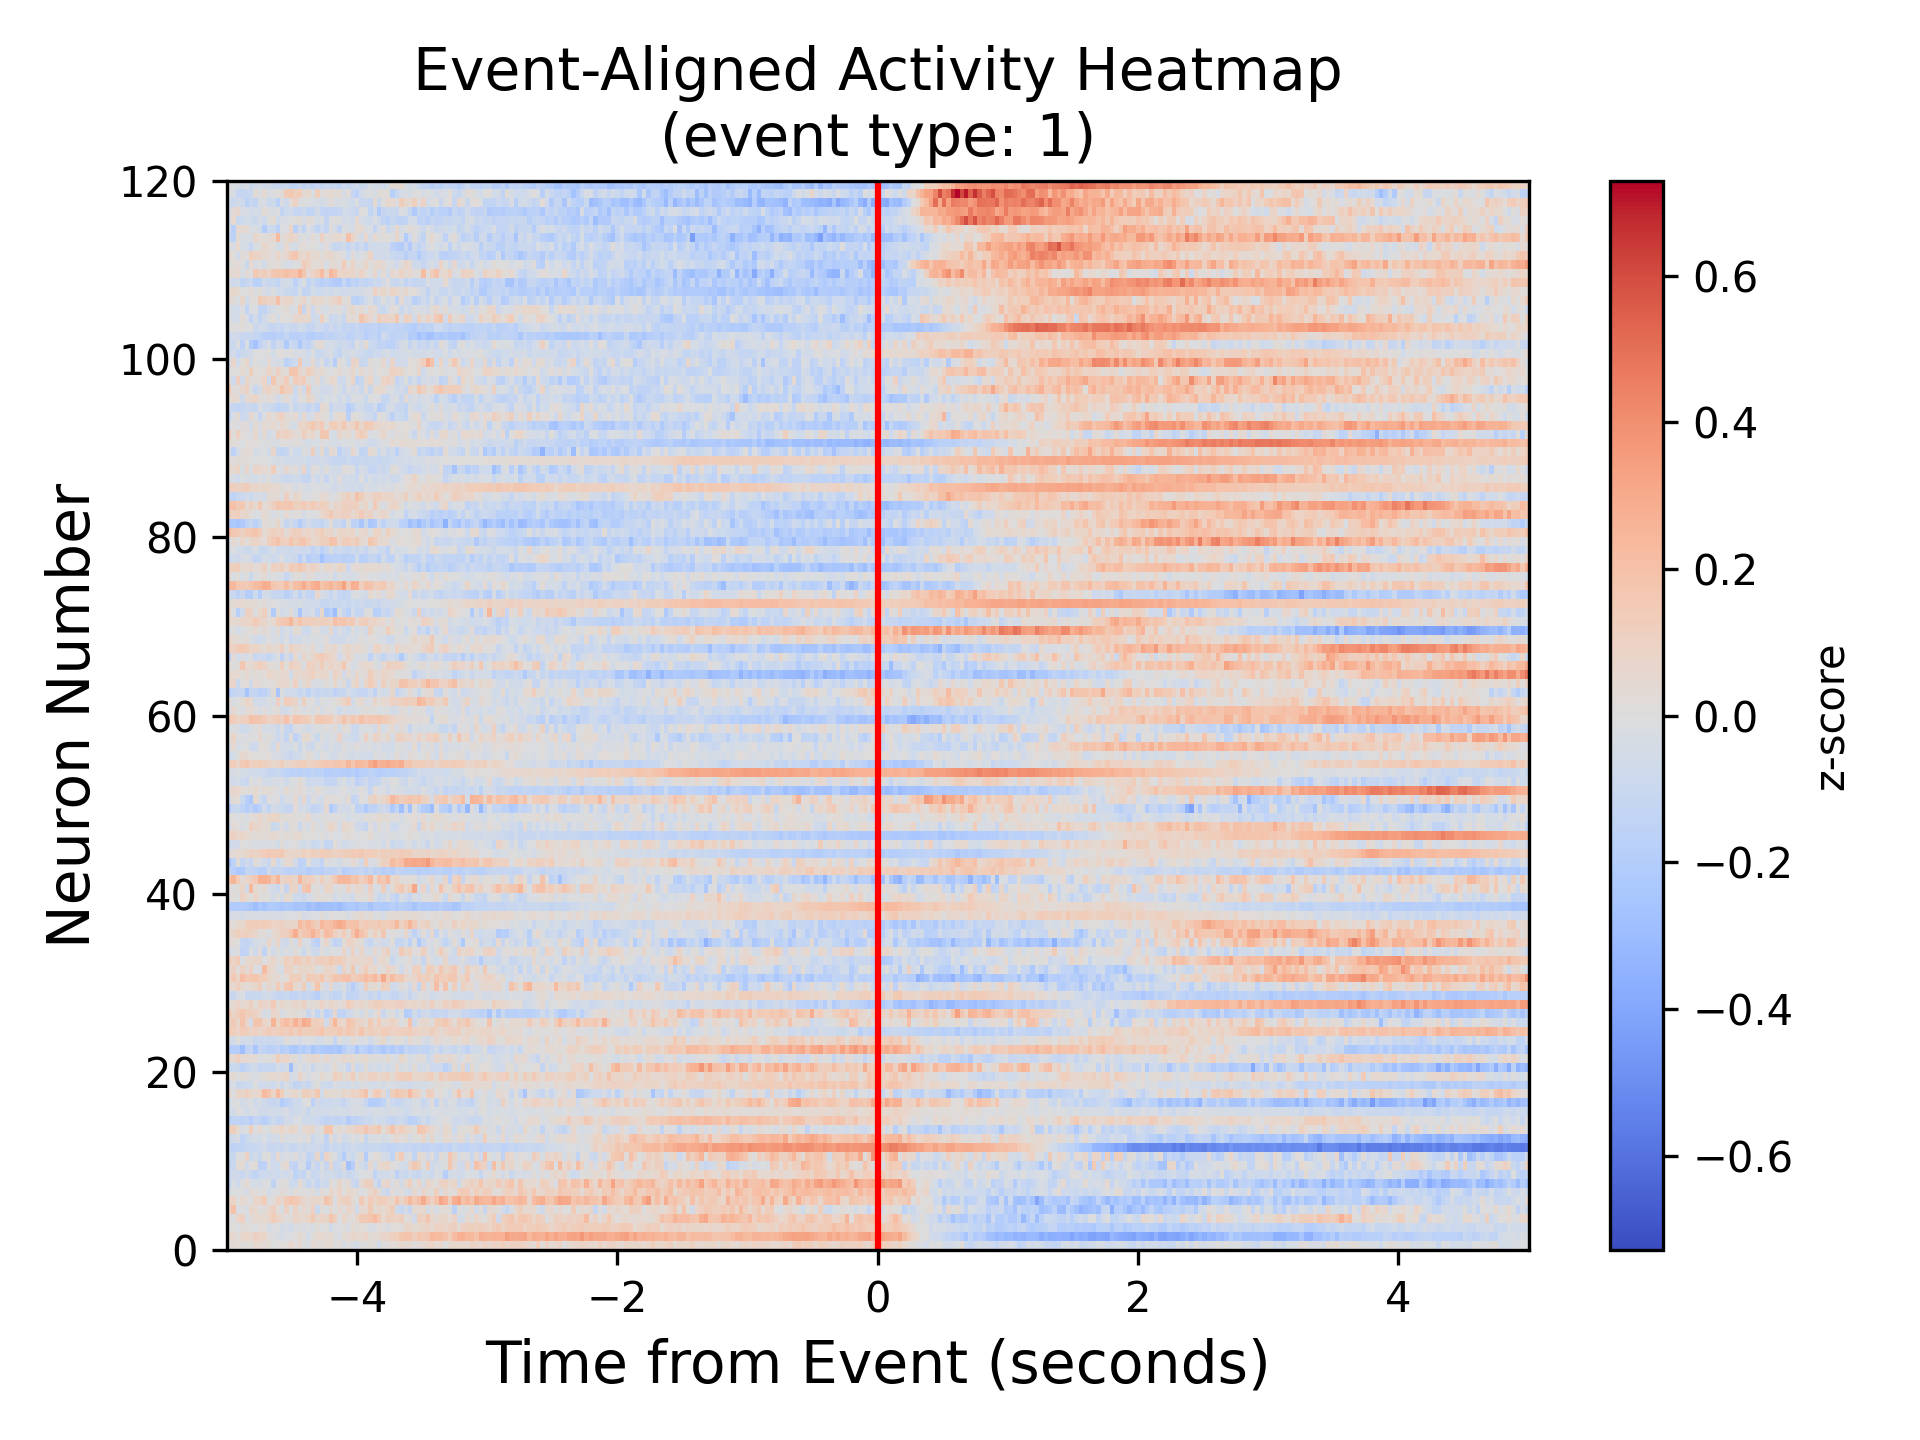
This plot shows the z-scored neural modulation around an event for each neuron in the field of view around an event (red vertical line). Warmer colors represent higher activity and cooler colors represent lower activity. The cells are sorted based on the modulation; cells are top are up-modulated whereas cells at the bottom of the plot are down-modulated. This plot captures the heterogeneity of signal which is difficult to deduce just from the analysis of pooled neural signal.
**Panel B: Event-Aligned population activity **
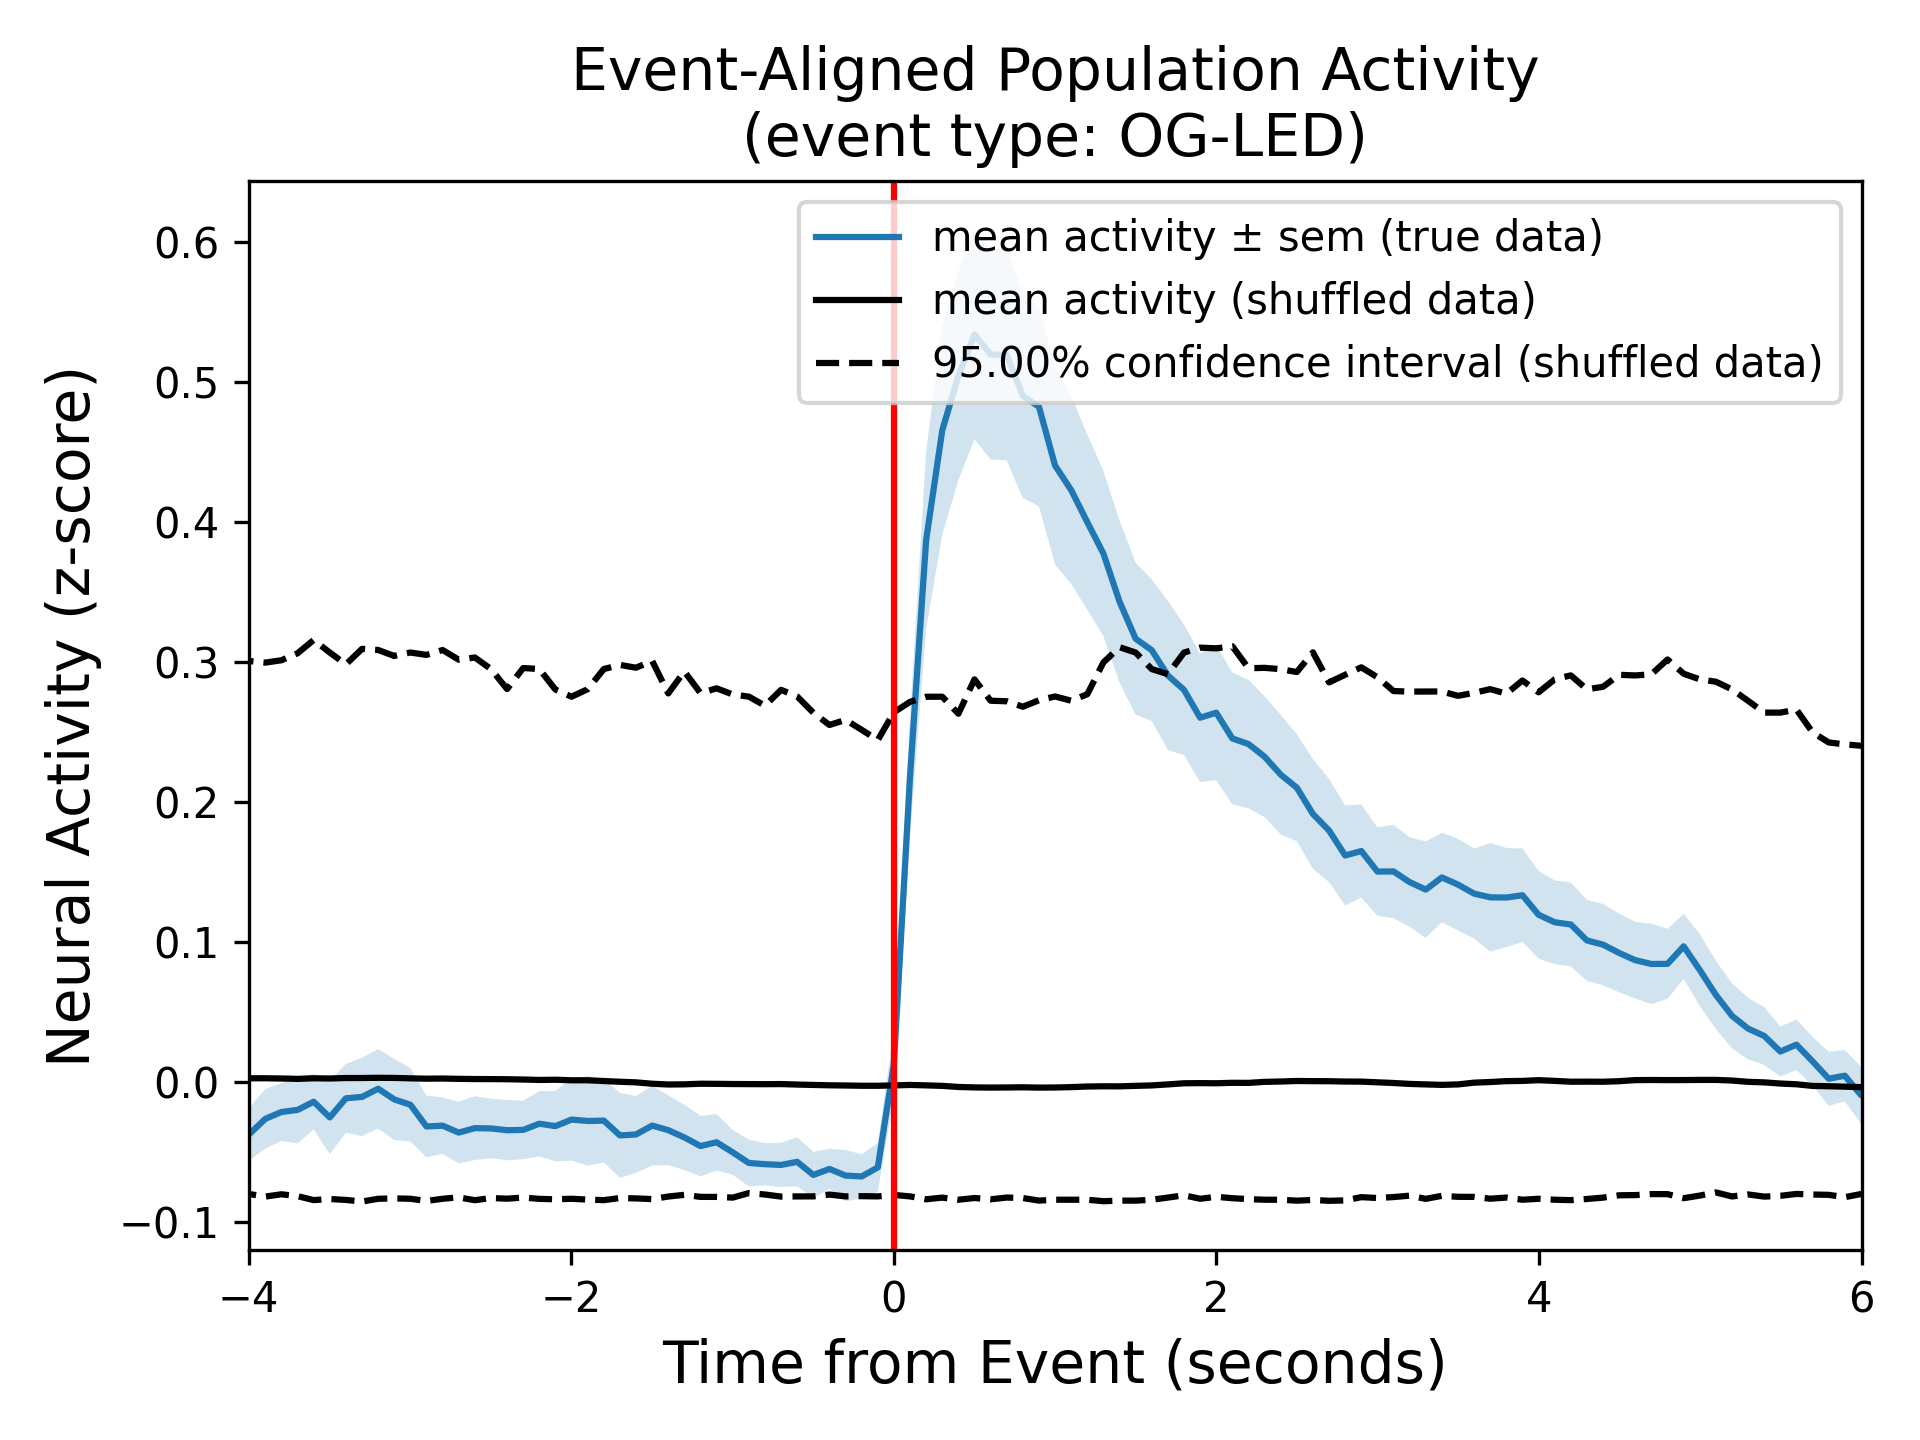
This plot provides information about the average z-scored neural activity for all neurons (blue trace) around an event (red vertical line). Specifically, the blue line represents the mean signal and the shaded light blue region represents the standard error of mean (SEM). The two black lines represent the upper and lower of the confidence interval of the null distribution obtained from the circular permutation test using shuffling, and is dictated by the ‘significance threshold’ parameter.
Panel C: Event-Aligned activity by modulation group
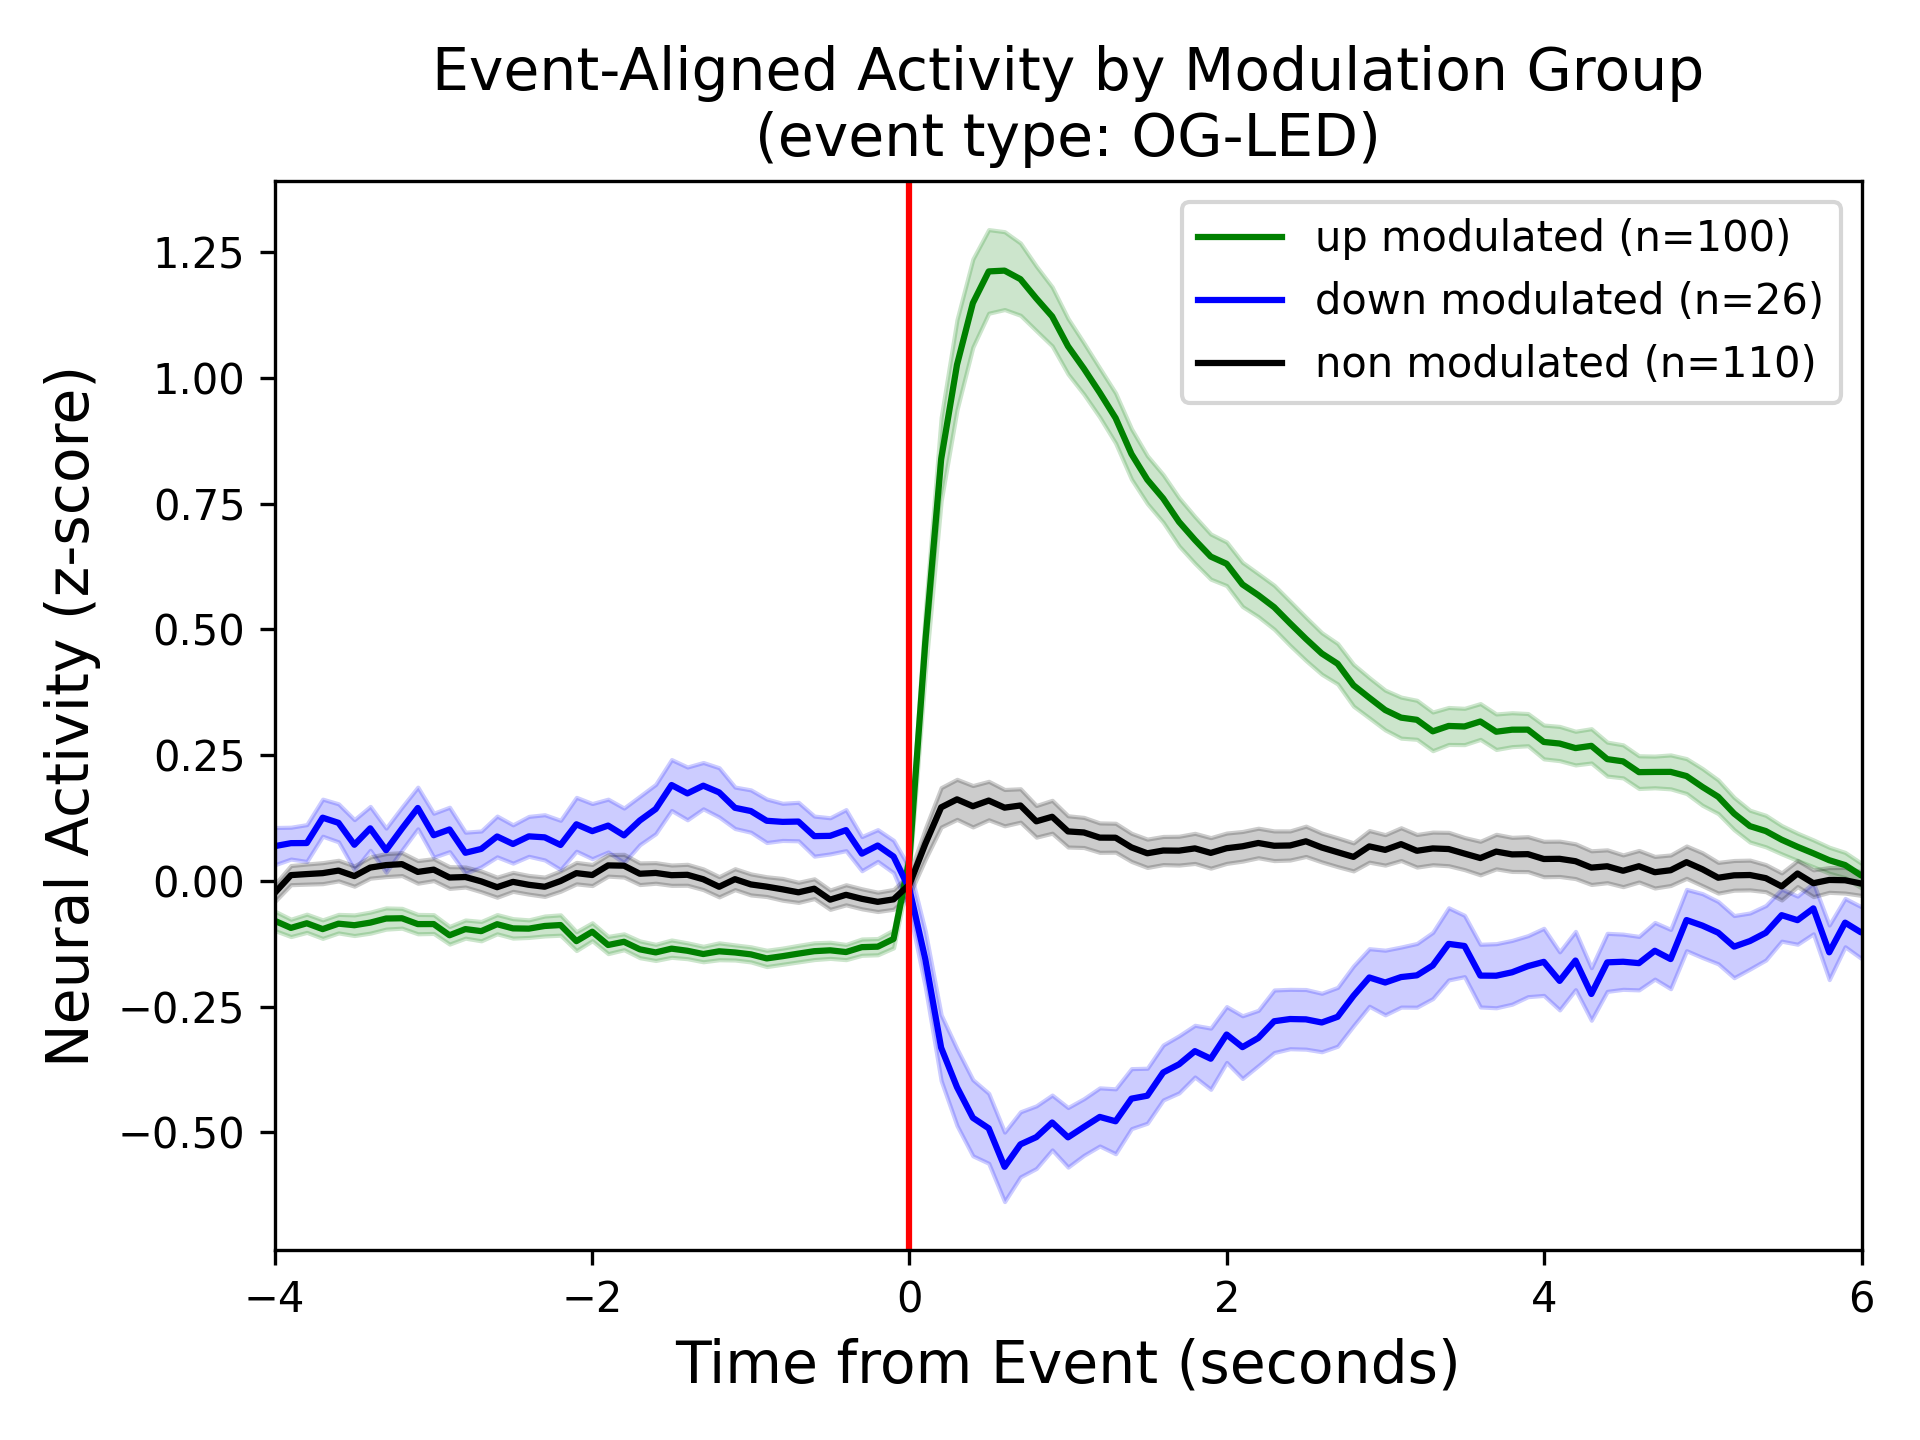
The average neural activity of the subpopulations of down-modulated (blue), up-modulated (green) and non-modulated (gray) neurons around an event (red vertical line). The line represents the mean and shaded region around the bold lines indicates the SEM.
Panel D: Cell map
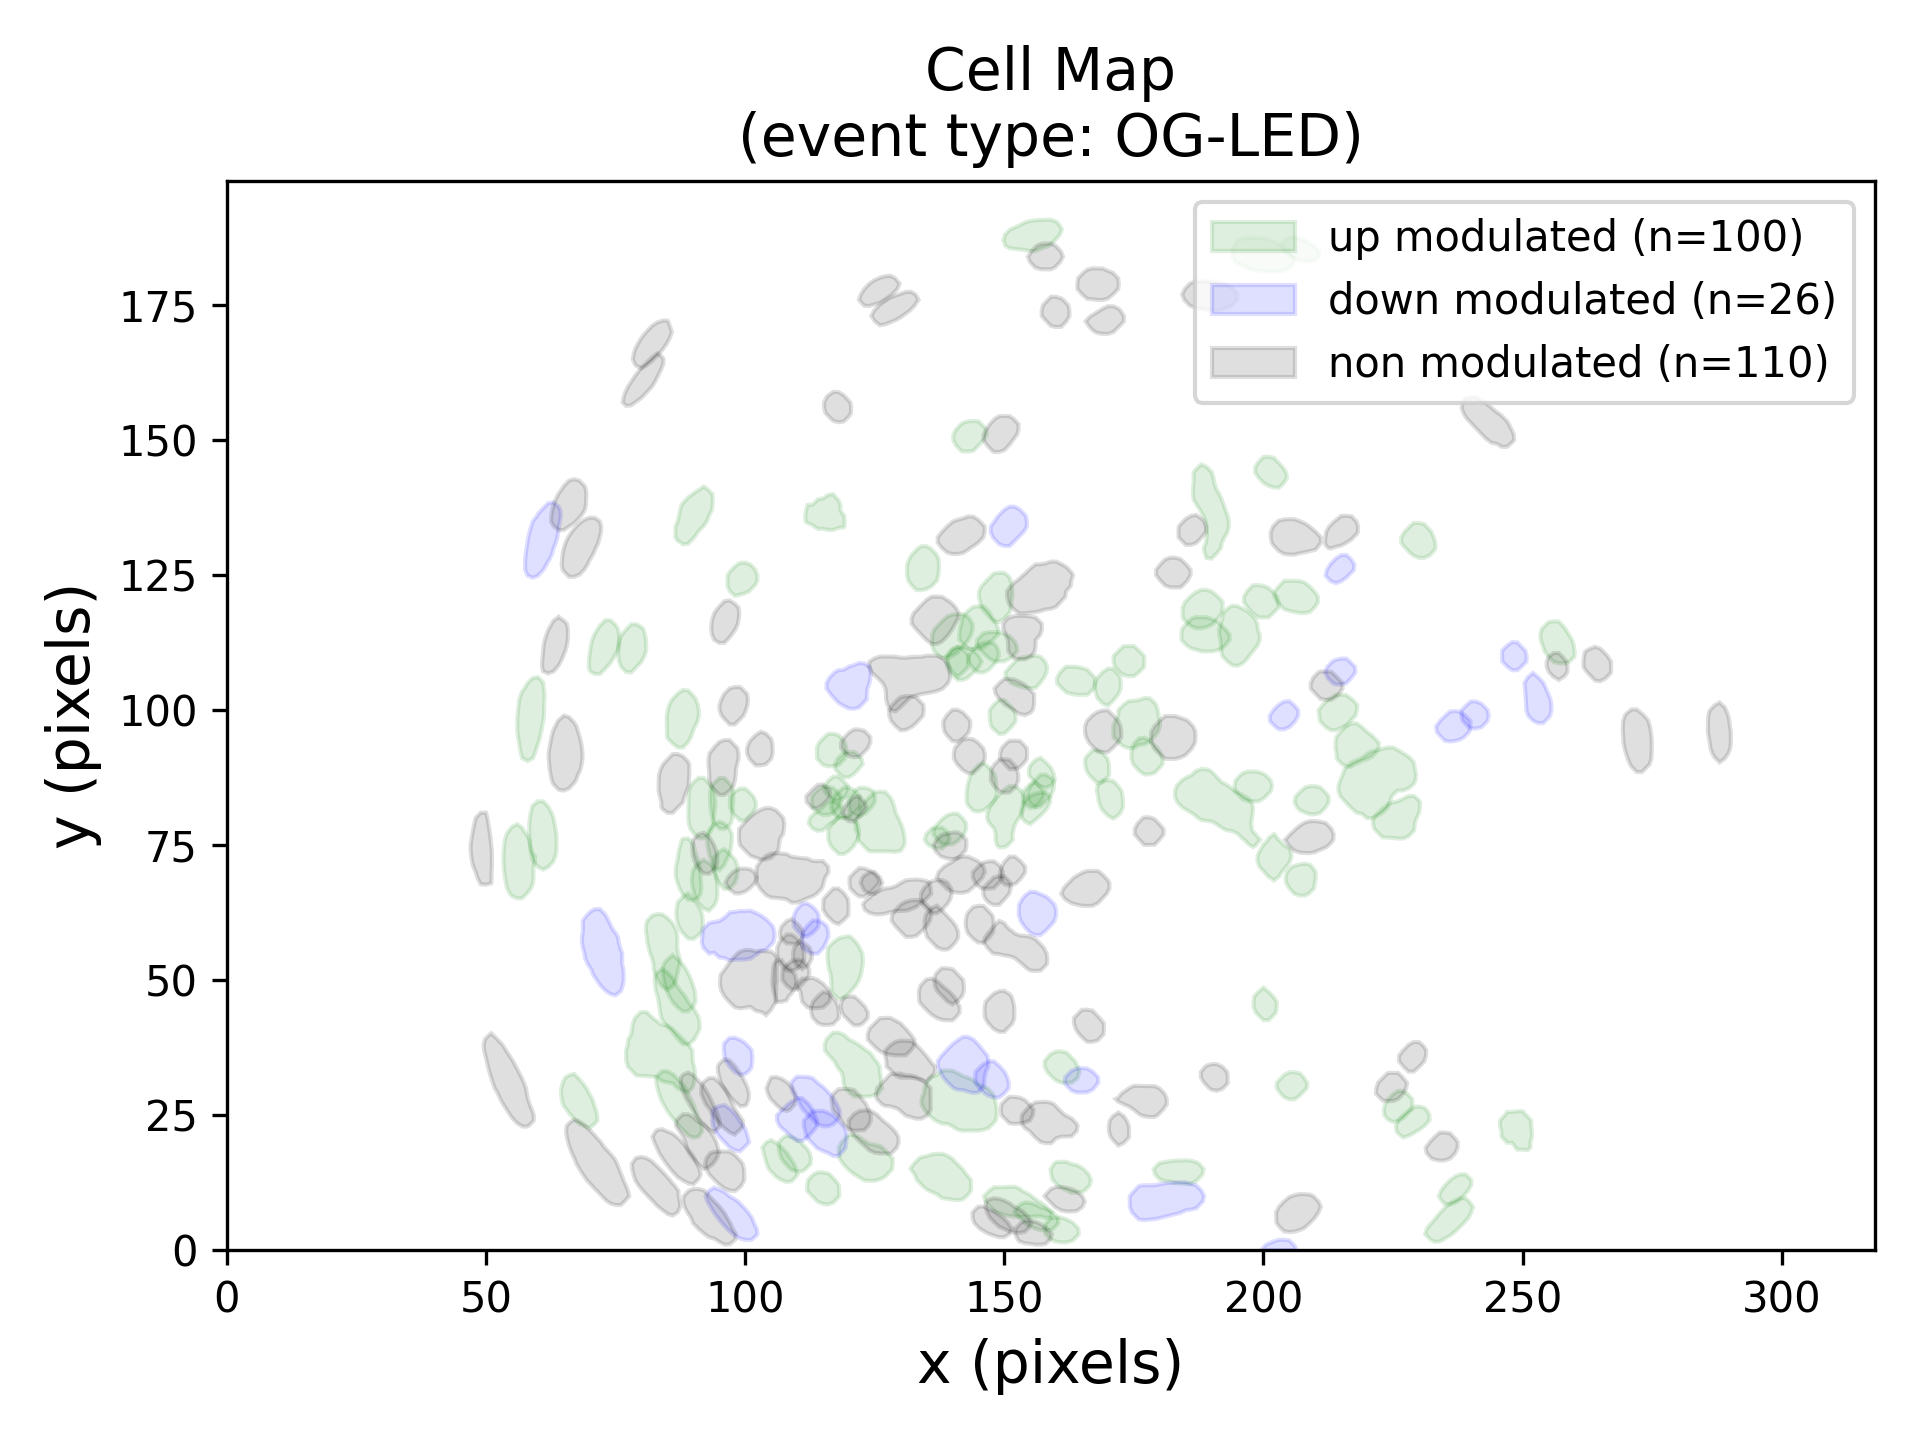
This plots provides the spatial locations of the centroids of each cell within the FOV. The color codes represent the category a cell belongs to. Blue disks are the down-modulated neurons, green disks are the up-modulated neurons and gray disks are the non-modulated neurons.
Output Data
For each event type, a total of 6 output files are produced. These output files can broadly fall into either one of the two categories: files containing actual data and files containing information for a preview. The (4) files containing the preview information have already been described in section Output preview The output files from the peri-event analysis workflow along with examples are described in detail below:
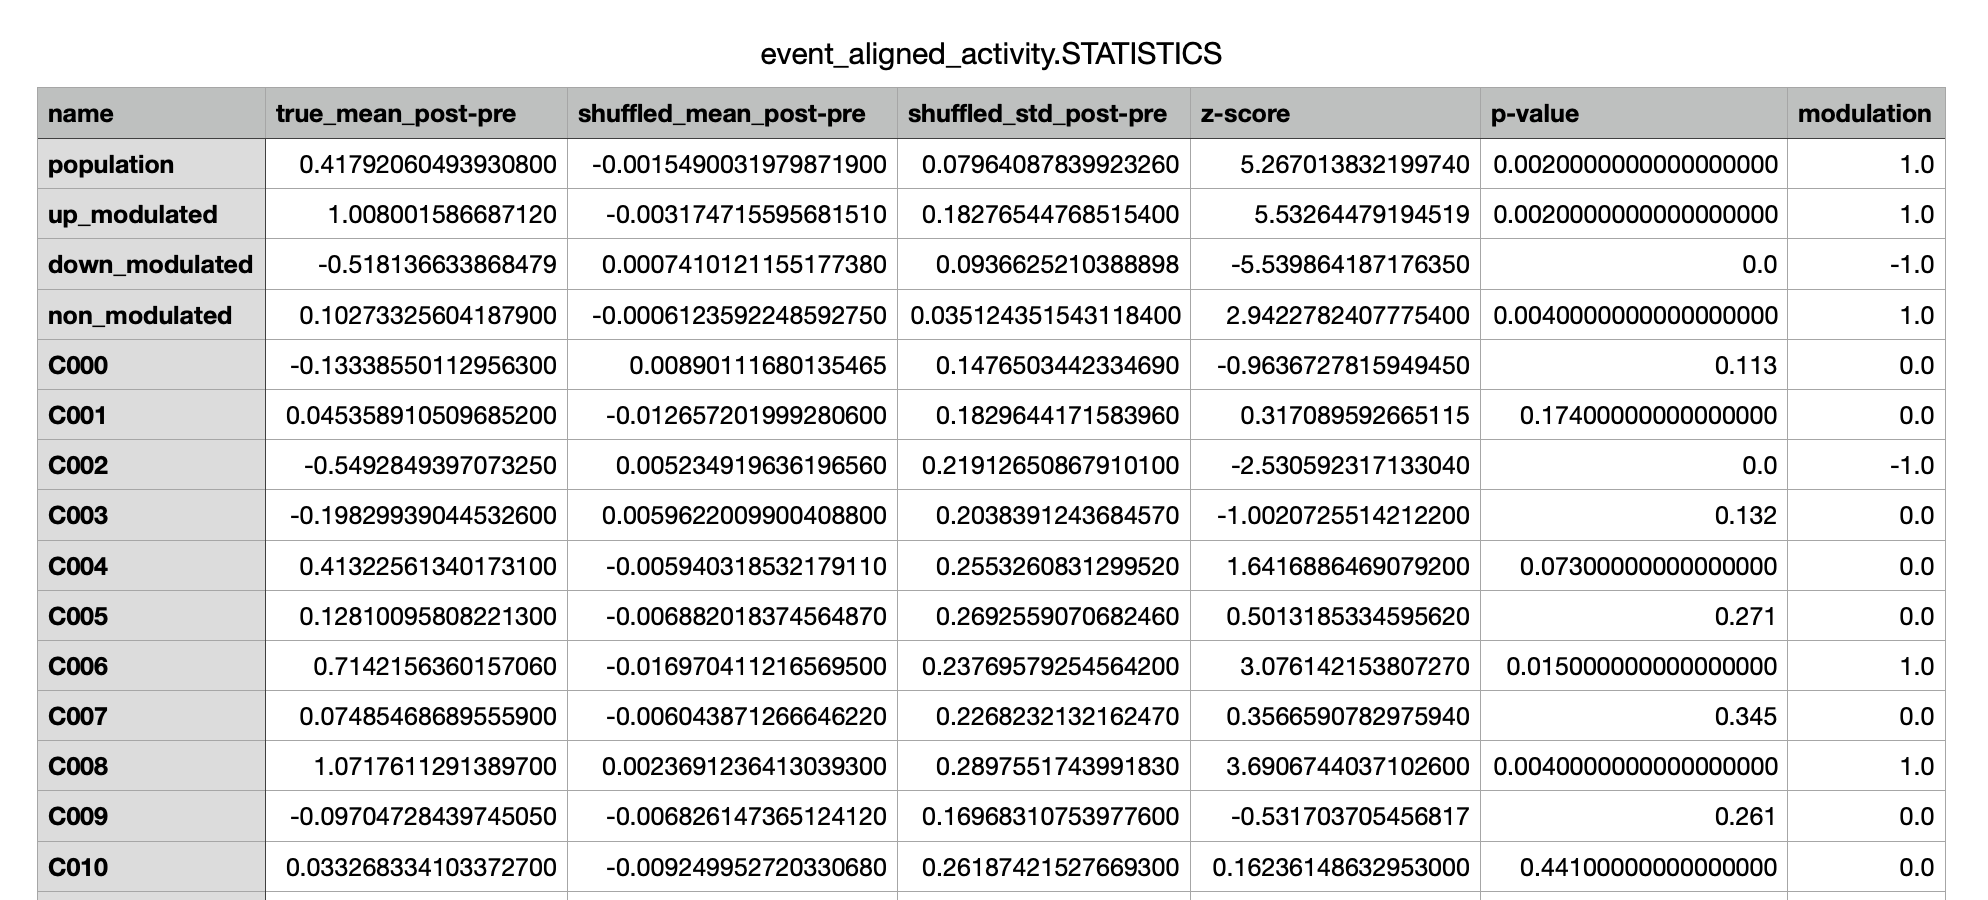
event_aligned_activity.STATISTICS.csv
A csv file containing the information about the output of statistical tests performed on each cell and
some its associated metrics.
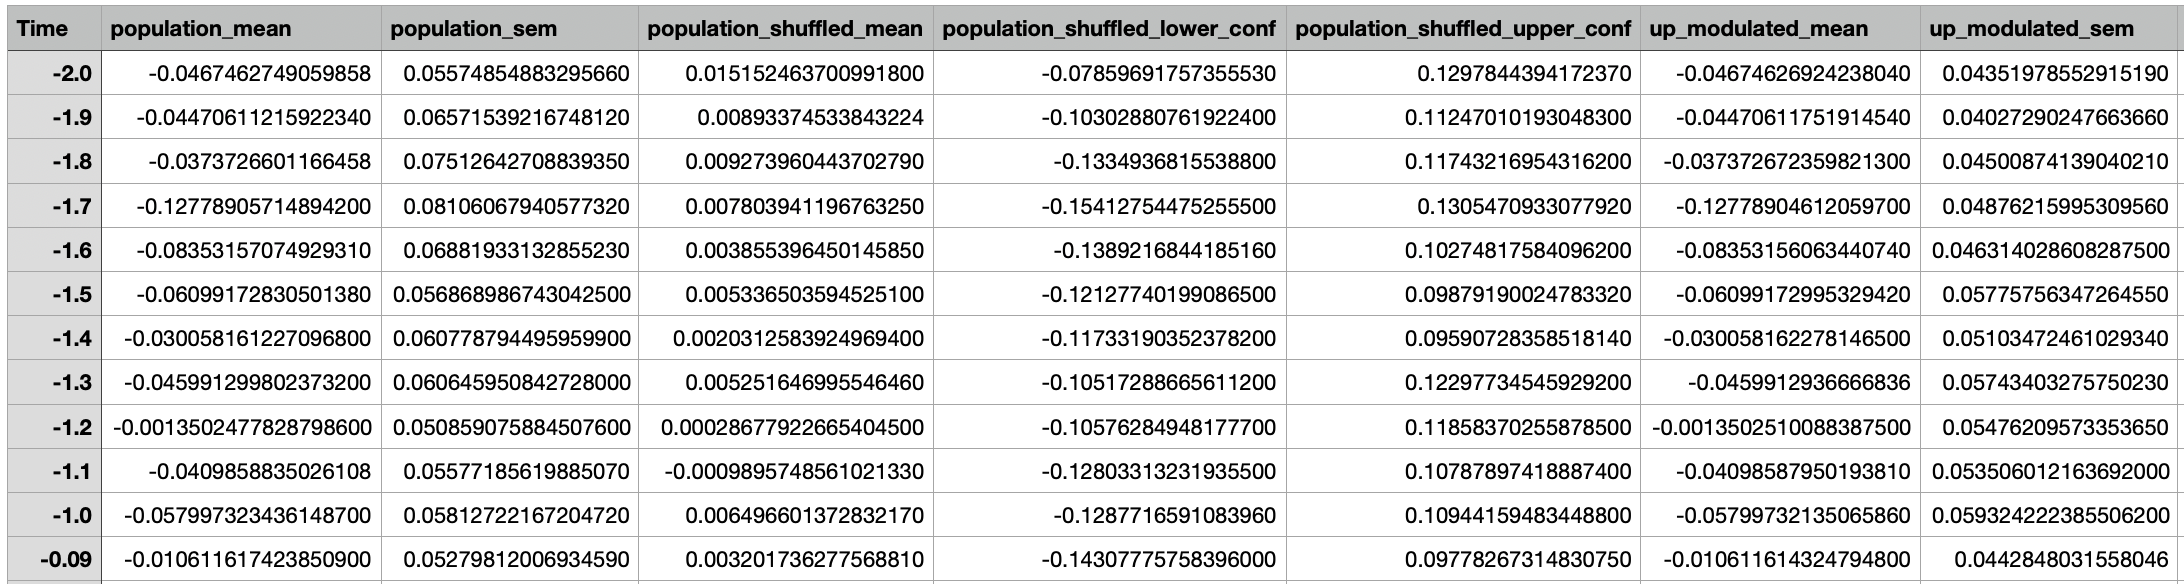
event_aligned_activity.TRACES.csv
A csv file containing the information about the event aligned activity of all cells.
Next Steps
After running this tool, the outputs can be used as input to the Combine and Compare Peri-Event Analysis Data tool.
-
Baylor, DuA, B. J. Nunn, and J. L. Schnapf. "Spectral sensitivity of cones of the monkey Macaca fascicularis." The Journal of Physiology 390, no. 1 (1987): 145-160. ↩
-
Turner, Maxwell H., and Fred Rieke. "Synaptic rectification controls nonlinear spatial integration of natural visual inputs." Neuron 90, no. 6 (2016): 1257-1271. ↩
-
Krumin, Michael, Julie J. Lee, Kenneth D. Harris, and Matteo Carandini. "Decision and navigation in mouse parietal cortex." Elife 7 (2018): e42583. ↩
-
Erlich, Jeffrey C., Bingni W. Brunton, Chunyu A. Duan, Timothy D. Hanks, and Carlos D. Brody. "Distinct effects of prefrontal and parietal cortex inactivations on an accumulation of evidence task in the rat." Elife 4 (2015): e05457. ↩
-
Zolin, Aryeh, Raphael Cohn, Rich Pang, Andrew F. Siliciano, Adrienne L. Fairhall, and Vanessa Ruta. "Context-dependent representations of movement in Drosophila dopaminergic reinforcement pathways." Nature neuroscience 24, no. 11 (2021): 1555-1566. ↩
-
Roitman, Jamie D., and Michael N. Shadlen. "Response of neurons in the lateral intraparietal area during a combined visual discrimination reaction time task." Journal of neuroscience 22, no. 21 (2002): 9475-9489. ↩
-
Fink, Andrew JP, Katherine R. Croce, Z. Josh Huang, L. F. Abbott, Thomas M. Jessell, and Eiman Azim. "Presynaptic inhibition of spinal sensory feedback ensures smooth movement." Nature 509, no. 7498 (2014): 43-48. ↩
-
Mamiya, Akira, Pralaksha Gurung, and John C. Tuthill. "Neural coding of leg proprioception in Drosophila." Neuron 100, no. 3 (2018): 636-650. ↩
-
Marshall, N.J., Glaser, J.I., Trautmann, E.M. et al. Flexible neural control of motor units. Nat Neurosci 25, 1492–1504 (2022). https://doi.org/10.1038/s41593-022-01165-8 ↩