Compare Neural Activity Across Epochs
This tool uses 1.0 compute credits per hour.
Overview
The Compare Neural Activity Across Epochs tool calculates the average activity of the calcium traces, the pairwise correlation of the calcium traces, and if an event set is provided, the average event rate during any number of user-specified epochs. An epoch can be any length but must be a single continous period. Examples of this epochs may be "Baseline, Early, Late", or "Baseline, Drug, Post-drug". The tool will then generate figures displaying the average activity and event rate of each each cell in each epoch, the pairwise difference in activity and event rate between each epoch, the timecourse of average population activity and average population event rate, and the average positive and negative correlation separately in each epoch.
New
Updates in version 2.0:
- Added two new rescaling methods: Standardize to first epoch and Fractional change from first epoch. (See Rescaling method for more details)
- Added parameter to specify the range of the colorbar in the traces preview.
Parameters
| Parameter | Required? | Default | Description |
|---|---|---|---|
| Cell Set Files | True | N/A | Cell set files |
| Event Set Files | False | N/A | Event set files |
| Define Epochs by | True | global file time | Method to define epochs. If 'files', one epoch per input cell set will be automatically defined, for the whole duration of each cell set. If 'global file time', you can define as many epochs as you want, with 0 corresponding to start time of the first cell set. If 'local file time', you can define as many epochs as you want per input cell set, with 0 corresponding to start time of each cell set. |
| Epochs | False | N/A | Tuples of the start and end times (in seconds) for each epoch (e.g., if 'Define Epochs by' is set to 'Global file time', (0, 600), (650, 950), (950, 1250)). If 'Define Epochs by' is set to 'Local file time', provide one list of tuple per input cell set file (e.g., [(0, 600)], [(0, 300), (300, 600)]). If 'Define Epochs by' is set to 'Files', you can leave this parameter empty. |
| Epoch Names | True | N/A | List of names of the epochs to analyze (e.g., baseline, early treatment, late treatment) |
| Epoch Colors | True | tab:grey, tab:blue, tab:cyan | List of matplotlib compatible colors to represent each epoch |
| Time Bin Size | False | N/A | If specified, the data will be averaged into bins of this size (in seconds), effectively downsampling the data |
| Traces Rescaling Method | False | none | The trace activity data will be rescaled using the specified method. If 'none' is selected, the original raw calcium trace values will be used without any transformation, preserving the original scale of the measurements. |
| Event Rates Rescaling Method | False | none | If specified, the event rate data will be rescaled using the specified method |
| Sort Files by Time | False | True | Whether to sort the cell set files by start time. If False, order of input cell sets is maintainted. |
| Sampling Rate Tolerance | False | 0.0001 | Tolerance for potential discrepancies in the sampling rate of input cell sets. If not specified, defaults to 1e-4. |
| Activity heatmap (colormap range) | False | Auto | Input min and max value separated by a comma to define the range of the colormap for the trace activity heatmap |
Input Files
The inputs to this tool are cellsets and optionally a corresponding event file. The cellset file is a .isxd file that contains the neural activity data. The event file is a .isxd file that contains the timestamps of events that occurred during the recording.
Input parameters
Epoch Definitions
This section describes how epochs can be defined and specified for analysis.
An epoch is a period of time that is defined by a start time, an end time, and a name. A color is also assigned to each epoch.
An epoch period represents the start and end time of an individual epoch as a tuple (start, end).
A comma-separated list of such tuples can be entered in the Epoch periods parameter to define the individual epochs.
The chosen epoch definition will determine how the algorithm interprets the specified epoch periods.
The table below summarizes how epochs can be defined and the corresponding format to use when specifying epoch periods.
| Epoch Defined By | Description | Example Epoch Periods |
|---|---|---|
| files | One epoch will automatically be defined for each input cell set file. The start and end time of each epoch will match the start and end time of the corresponding cell set file. | No epoch periods need to be specified under this definition. The Epoch periods field is ignored when defining epochs by files. |
| global file time | Under this definition, the overall timeline is obtained by combining the duration of the input recordings together. For instance, if there are two input cell sets, each with a duration of 10 seconds, the total duration would be 20 seconds. Any time gaps between files are not considered; in other words, files can be considered as if they were concatenated. An arbitrary number of epochs can be defined by specifying the start and end time of each epoch in seconds relative to the start time of the first cell set, i.e. 0 seconds. The epochs are specified as a comma-separated list of (start, end) tuples as shown in the example on the right. |
(0,10), (11,20) In this example, two epochs are defined. The first epoch consists of the first 10 seconds while the second epoch starts 11 seconds after the start of the first recording and ends at 20 seconds. |
| local file time | Under this definition, epochs are defined independently for each input cell set file. An arbitrary number of epochs within each cell set file can be defined by specifying the start and end time of each epoch in seconds relative to the start time of the corresponding cell set. Square brackets [ ... ] are used to represent each file and encapsulate a list of comma-separated (start, end) tuples defining the epochs within the corresponding files. An example is provided on the right. |
[(0, 10)], [(0,20), (30,50)] In this example, three epochs are defined. The first epoch consists of the first 10 seconds of the first input cell set file. The second epoch consists of the first 20 seconds of the second input cell set file. The third epoch consists of the time period starting 30 seconds after the start time of the second recording and ending at 50 seconds relative to the start of that same recording. |
Epoch Names
Epoch names are specified as a list of names separated by commas. The names should be unique from each other.
Epoch Colors
The colors are specified as a list of colors separated by commas. The list of colors should be the same length as the list of epoch names. The colors should be in the form of a string that can be interpreted by matplotlib.
Time Bin
The time bin is an optional parameter that specifies a time bin in seconds to bin the calcium traces and event rates. If the time bin is not provided, the files will be processed at the original sampling rate.
Rescaling Method
There are three options to rescale the calcium traces and event rates, which can be selected independently.
The options are as follows:
| Option | Description |
|---|---|
| None | The calcium traces are not rescaled. |
| Standardize | The calcium traces and event rates are standardized to have a mean of 0 and a standard deviation of 1. This process removes differences in baseline activity and scale, comparing the relative variance between cells on a common scale. |
| Normalize | The calcium traces and event rates are normalized to have a minimum of 0 and a maximum of 1. This ensures that each cell contributes equal variance to the population mean. |
| Standardize to first epoch | The calcium traces and event are standardized to have a mean of 0 and a standard deviation of 1 within each cell, using the first epoch as the reference. This process removes differences in baseline activity and scale, comparing the relative variance to a baseline epoch. Note: The epochs do not need to be listed in chronological order, so the first defined epoch does not need to be the first epoch in the recording. |
| Fractional change from first epoch | The calcium traces and event rates are normalized to have an average of 1 during the first epoch, and the fractional change is calculated for each cell in each epoch. Note: The epochs do not need to be listed in chronological order, so the first defined epoch does not need to be the first epoch in the recording. |
Algorithm details
The tool uses several metrics to measure and analyze population activity, described in the following sections:
Average measures
When the activity of a cell is measured, the mean of the rescaled value is used. When the average correlation is measured, a mean is taken of the positive elements of the correlation and the negative elements of the correlation separately.
Correlation
Pairwise correlation is calculated between each cell in the population. The correlation is calculated using the Pearson correlation coefficient, implemented using np.corrcoef() using default arguments.
Cell Statuses
Individual cell statuses stored in the input cell set are used to determine which cells to include in the analysis. If there are accepted cells, only accepted cells will be used. If there are no accepted cells, only undecided cells will be used. If all cells are rejected, the workflow will raise an error to inform the user.
Outputs
Trace time course
The tool will return a .npy file with the activity of each cell across time. If a time bin is provided, the time course will be binned into the specified time bin.
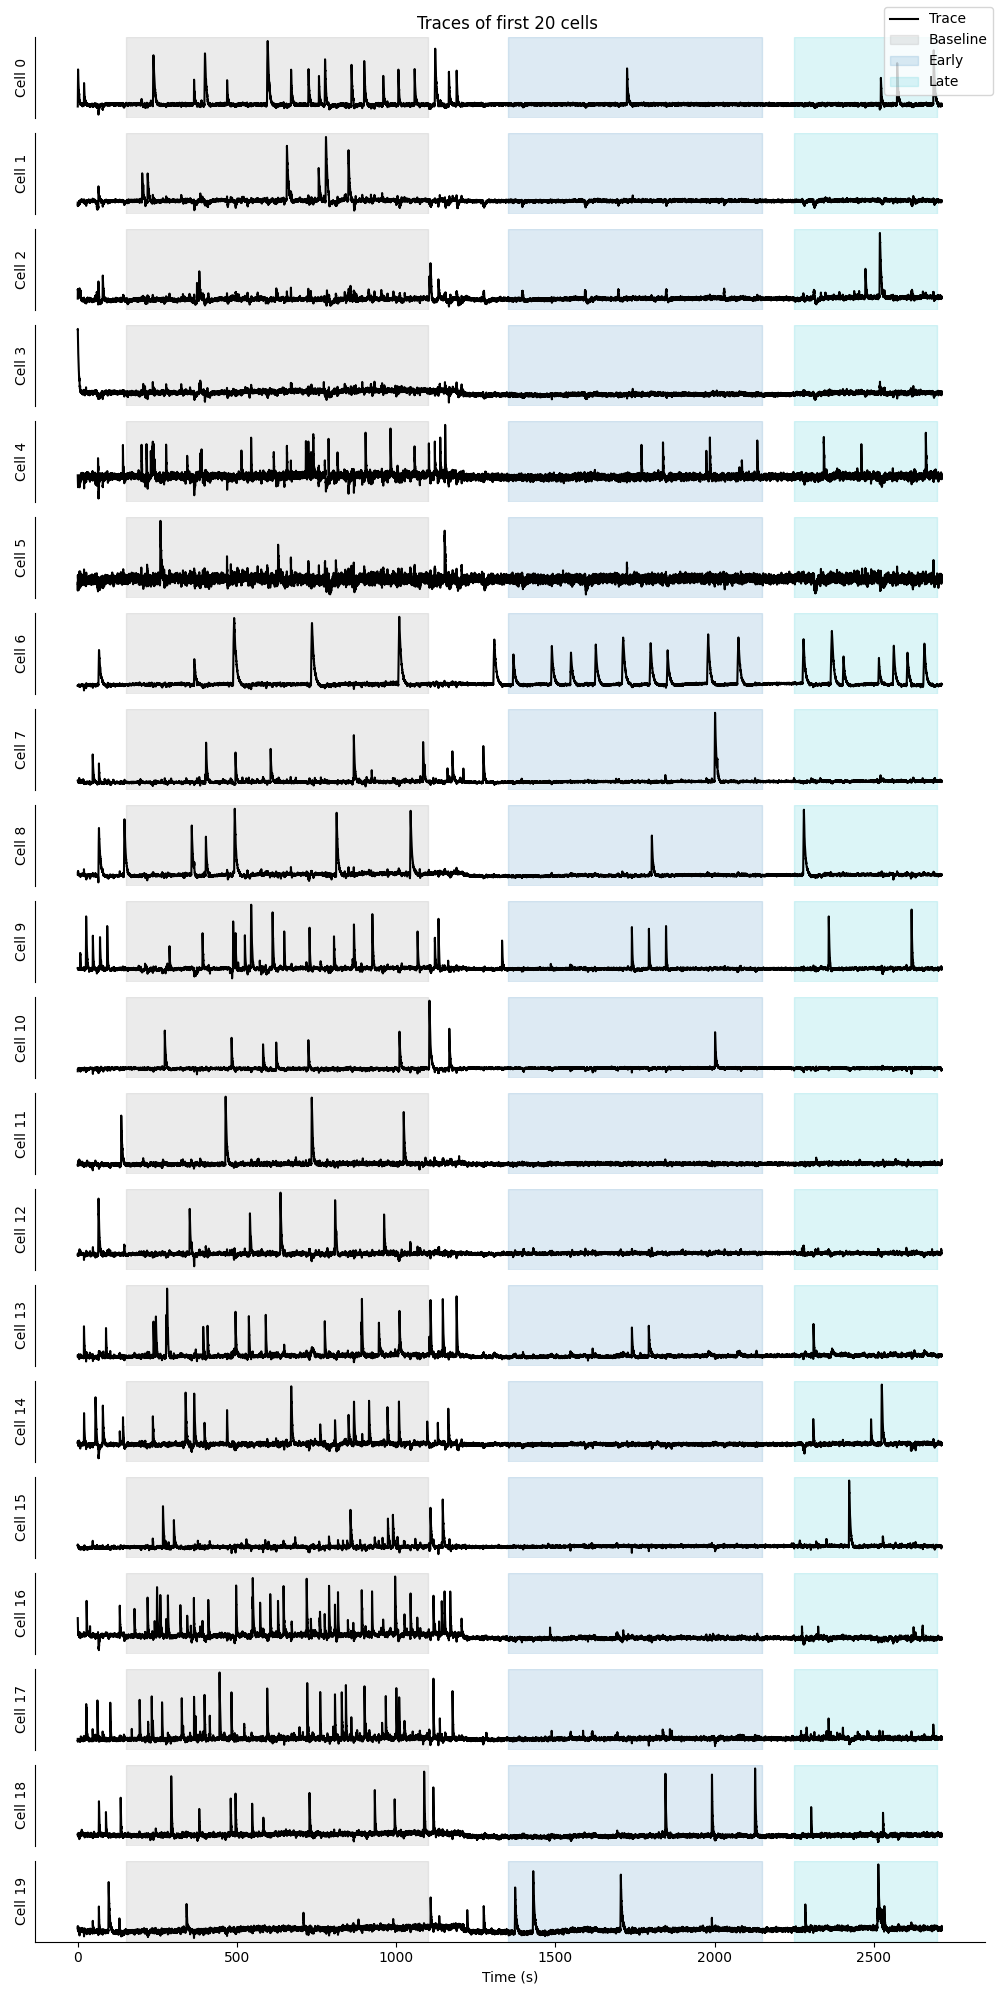
Trace preview
This preview will show the traces of the first 20 cells in the population, with the epoch periods highlighted in the background.
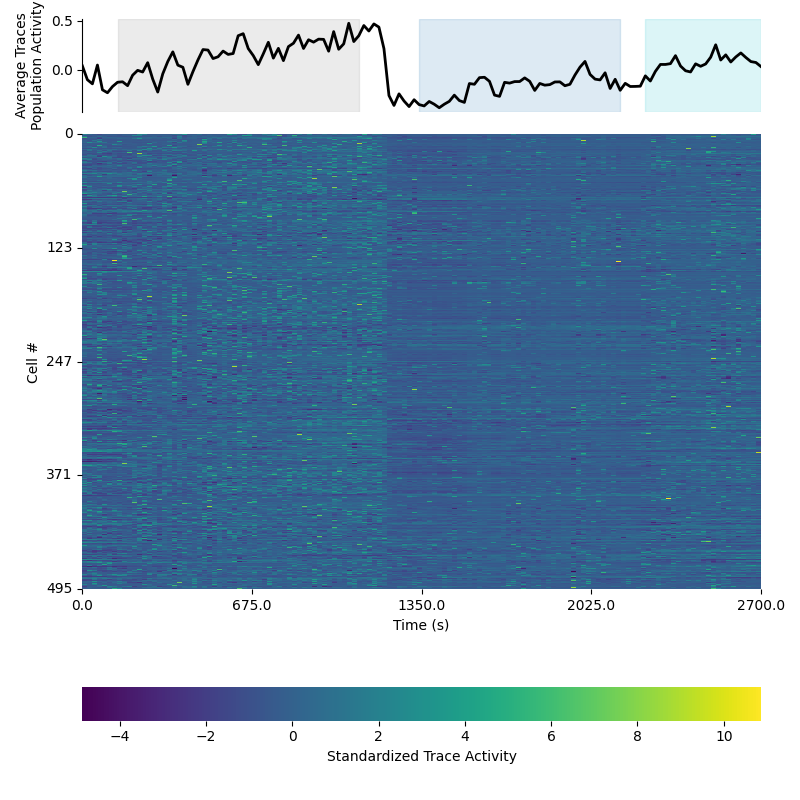
Single cell time course preview
This preview will show the time course of the activity of all cells across time as a heat map. The top panel will also show the average population activity level with the epochs highlighted. Below is an example of the time course preview on standardized data:
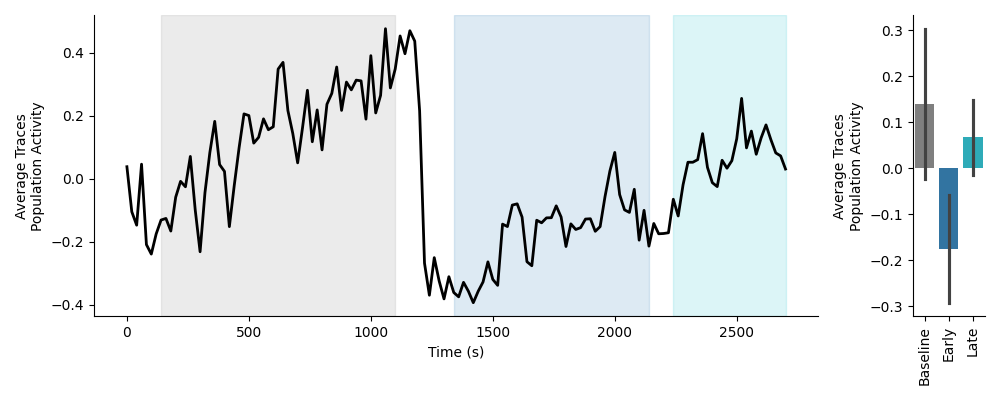
Population time course preview
This preview will show the average activity of the population of neurons across time on the left, with each epoch highlighted. The average population activity within each epoch is plotted as a bar plot on the right. Below is an example of the time course preview on standardized data:
Trace Activity Data
The tool will return a .csv file with individual cells as rows, and the columns will contain the average activity of each cell in each epoch. An example of the output file is shown below:
| Epoch | Cell | Activity |
|---|---|---|
| Example1 | 0 | 0.0000 |
| Example1 | 1 | 0.0050 |
| Example1 | 2 | 0.0550 |
| Example1 | 3 | 0.0150 |
| Example1 | 4 | 0.0050 |
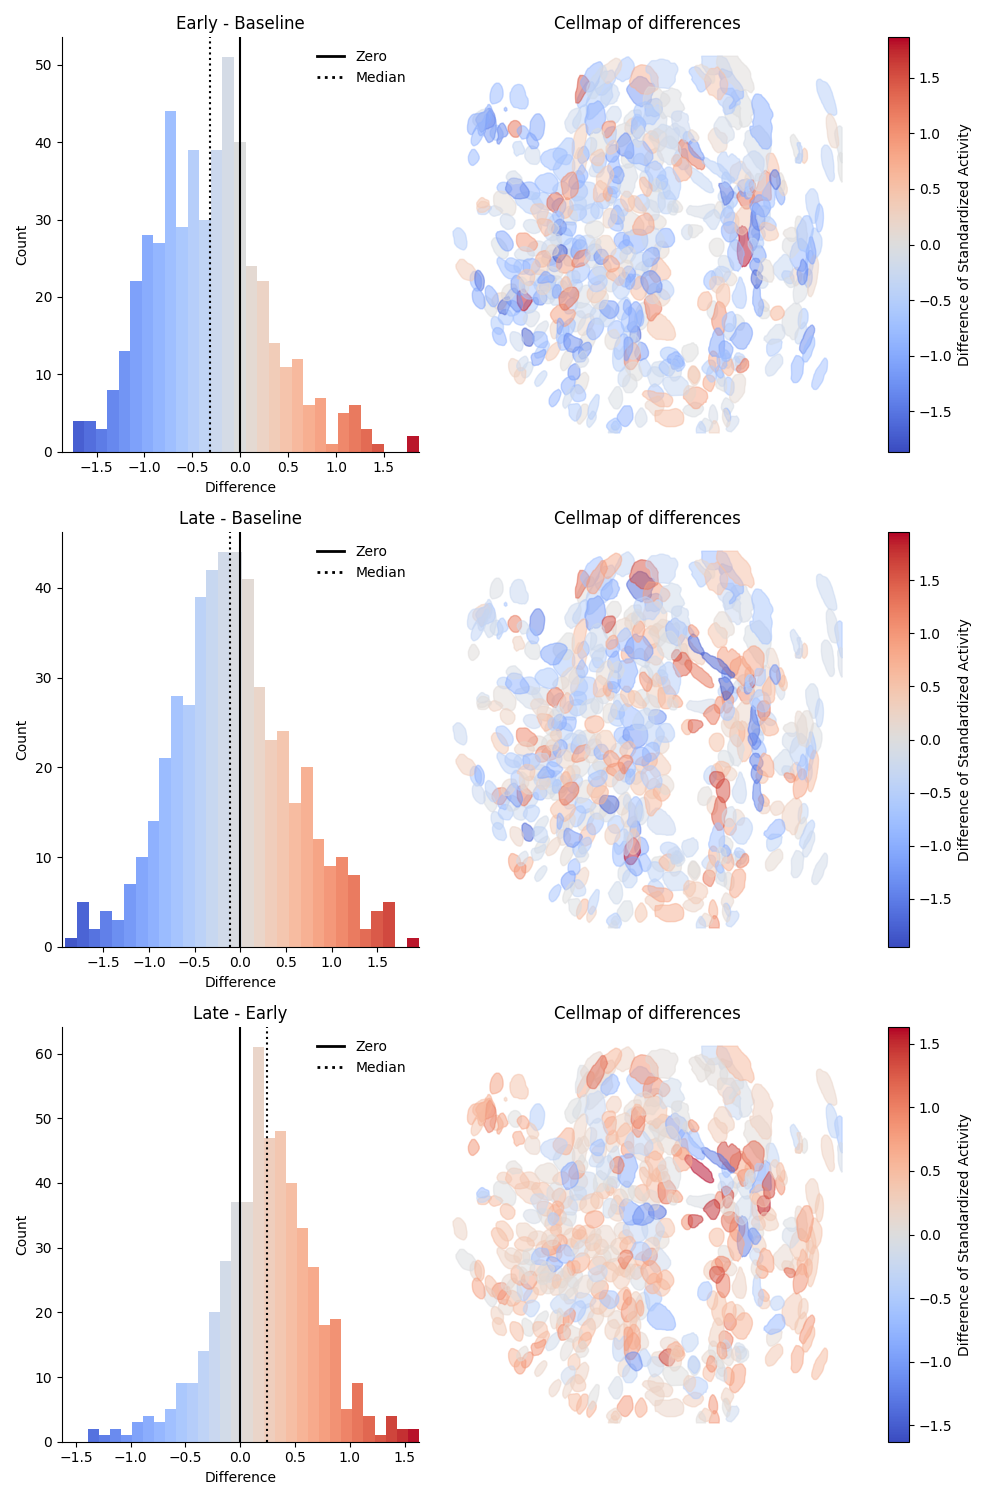
Epoch - Epoch differences preview
This preview shows the pairwise difference in activity for each combination of epochs as rows. The difference is taken as Later Epoch - Earlier Epoch. The left column will show a histogram of the differences, colored by relative change. The median is indicated by a dotted black line. The right column will show a cell map of the cells in the population, with the cells colored by magnitude of relative change. On the far right is a colorbar mapping the relative change. Below is an example of the differences preview on standardized data:
Calcium activity comparison
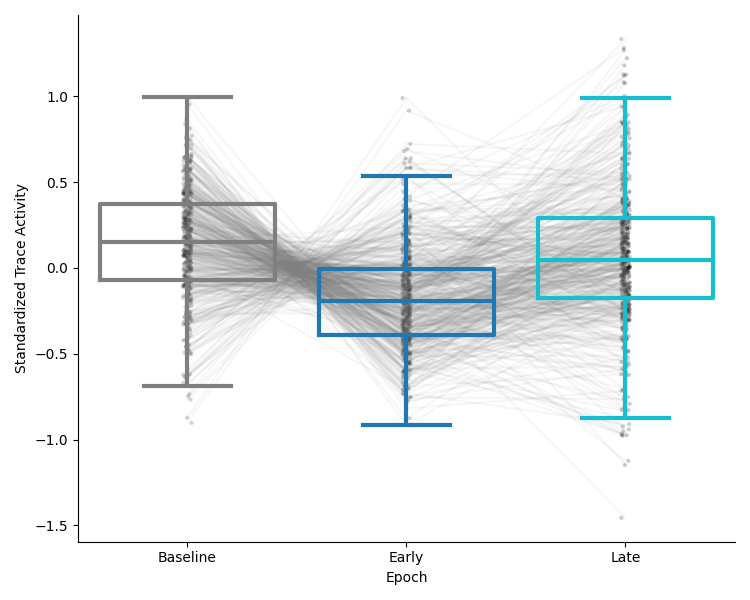
This preview will show a comparison of the average activity of the population of neurons in each epoch as a box and strip plot, with lines connecting the same cell in each epoch. The y-axis will show the average scaled trace activity in each epoch. Below is an example of the activity comparison on standardized data:
Trace correlation
The tool will return a .npy file with the raw correlation matrix (not clustered) of the population of neurons as a dictionary.
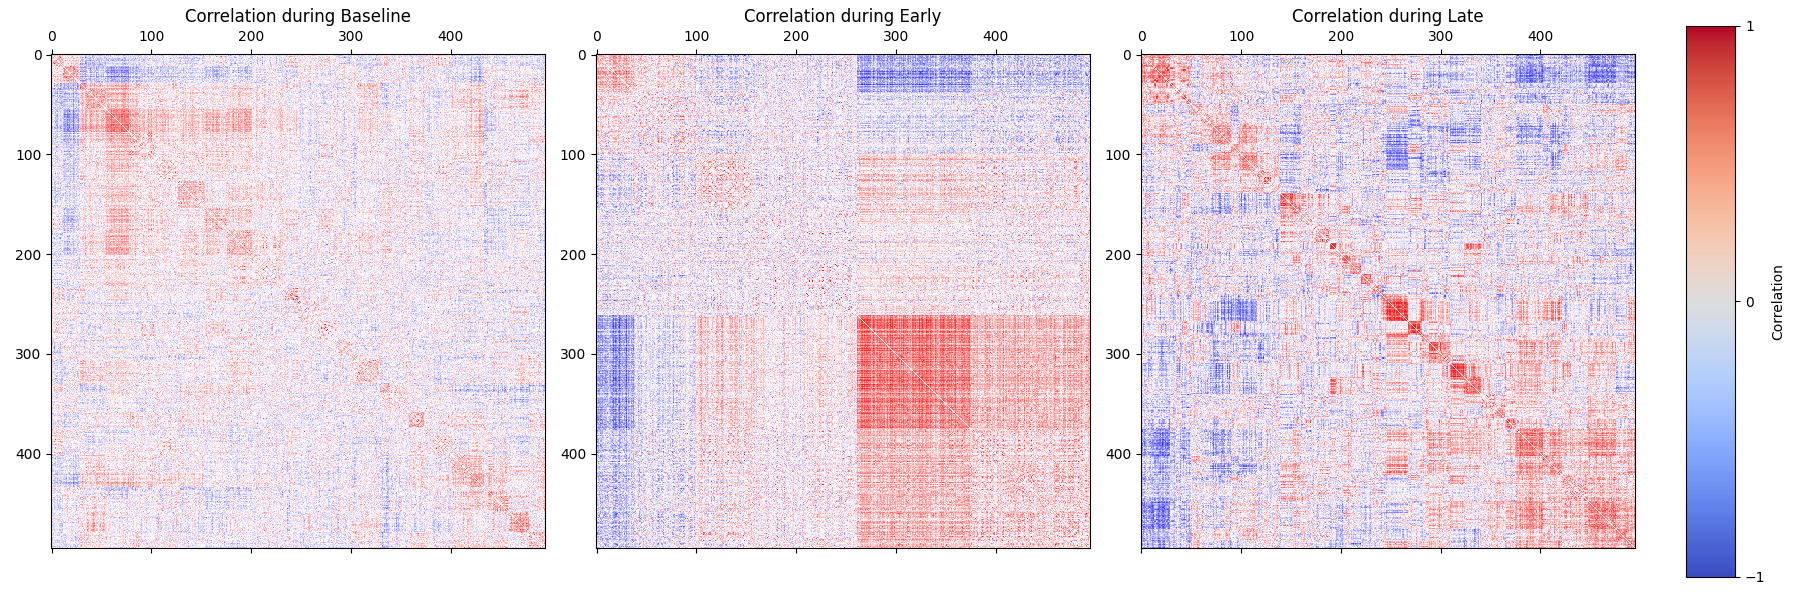
Clustered correlation preview
This preview will show the pairwise correlation matrix of each epoch, with similar cells clustered together. The correlation matrix will be colored by the correlation value, with a colorbar on the right.
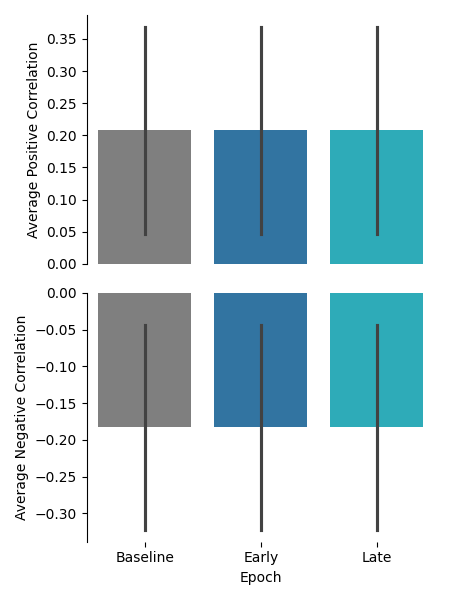
Average correlation preview
This preview will show the average positive correlation and average negative correlation of the population of neurons in each epoch as a bar plot.
Event Rate time course
The tool will return a .npy file with the eventrate of each cell across time. If a time bin is provided, the time course will be binned into the specified time bin.
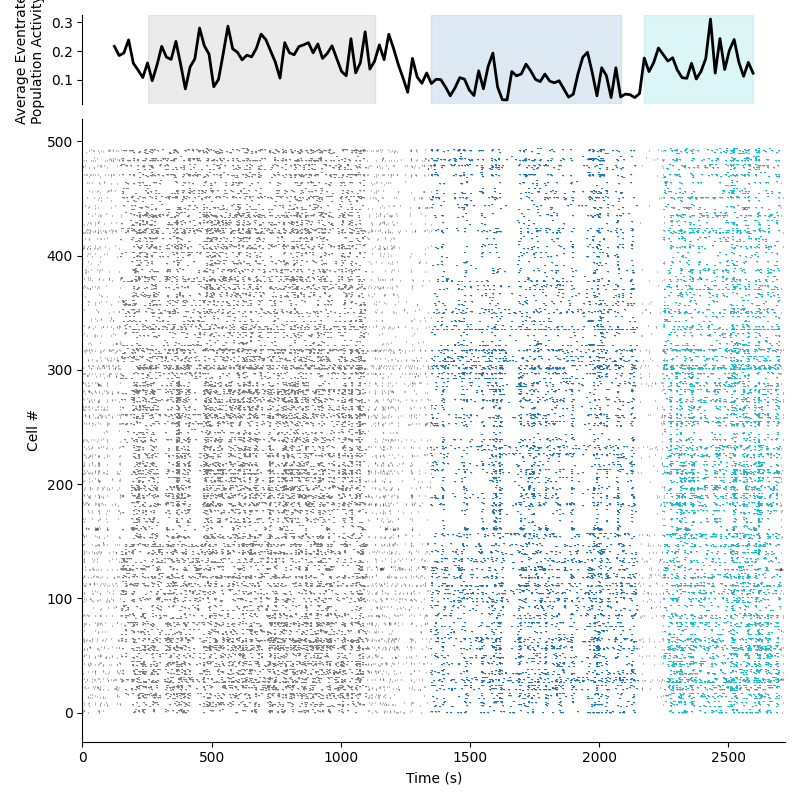
Single cell time course preview
This preview will show a rasterplot of all cells across time. The top panel will also show the average population event rate with the epochs highlighted. Below is an example of the time course preview on normalized data:
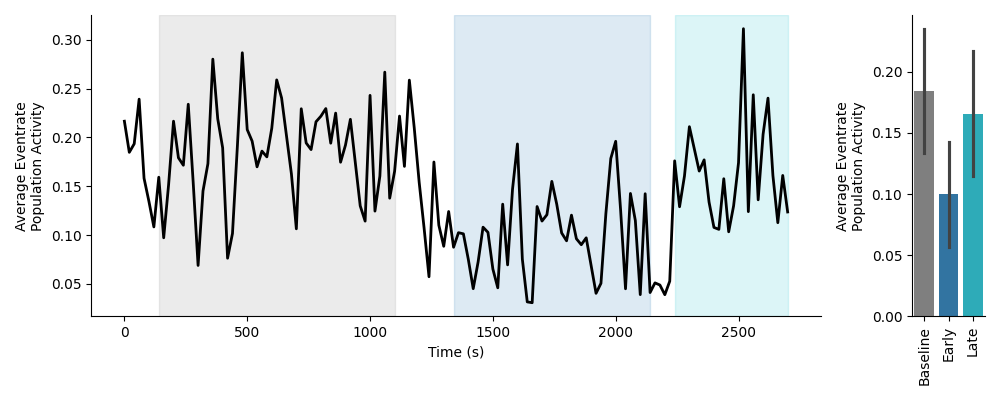
Population time course preview
This preview will show the average eventrate of the population of neurons across time on the left, with each epoch highlighted. The average eventrate activity within each epoch is plotted as a bar plot on the right. Below is an example of the time course preview on normalized data:
Event Rate Activity Data
If an event set is provided, the tool will return a .csv file with individual cells as rows, and the columns will contain the average event rate of each cell in each epoch. An example of the output file is shown below:
| Epoch | Cell | Activity |
|---|---|---|
| Example1 | 0 | 0.0000 |
| Example1 | 1 | 0.0050 |
| Example1 | 2 | 0.0550 |
| Example1 | 3 | 0.0150 |
| Example1 | 4 | 0.0050 |
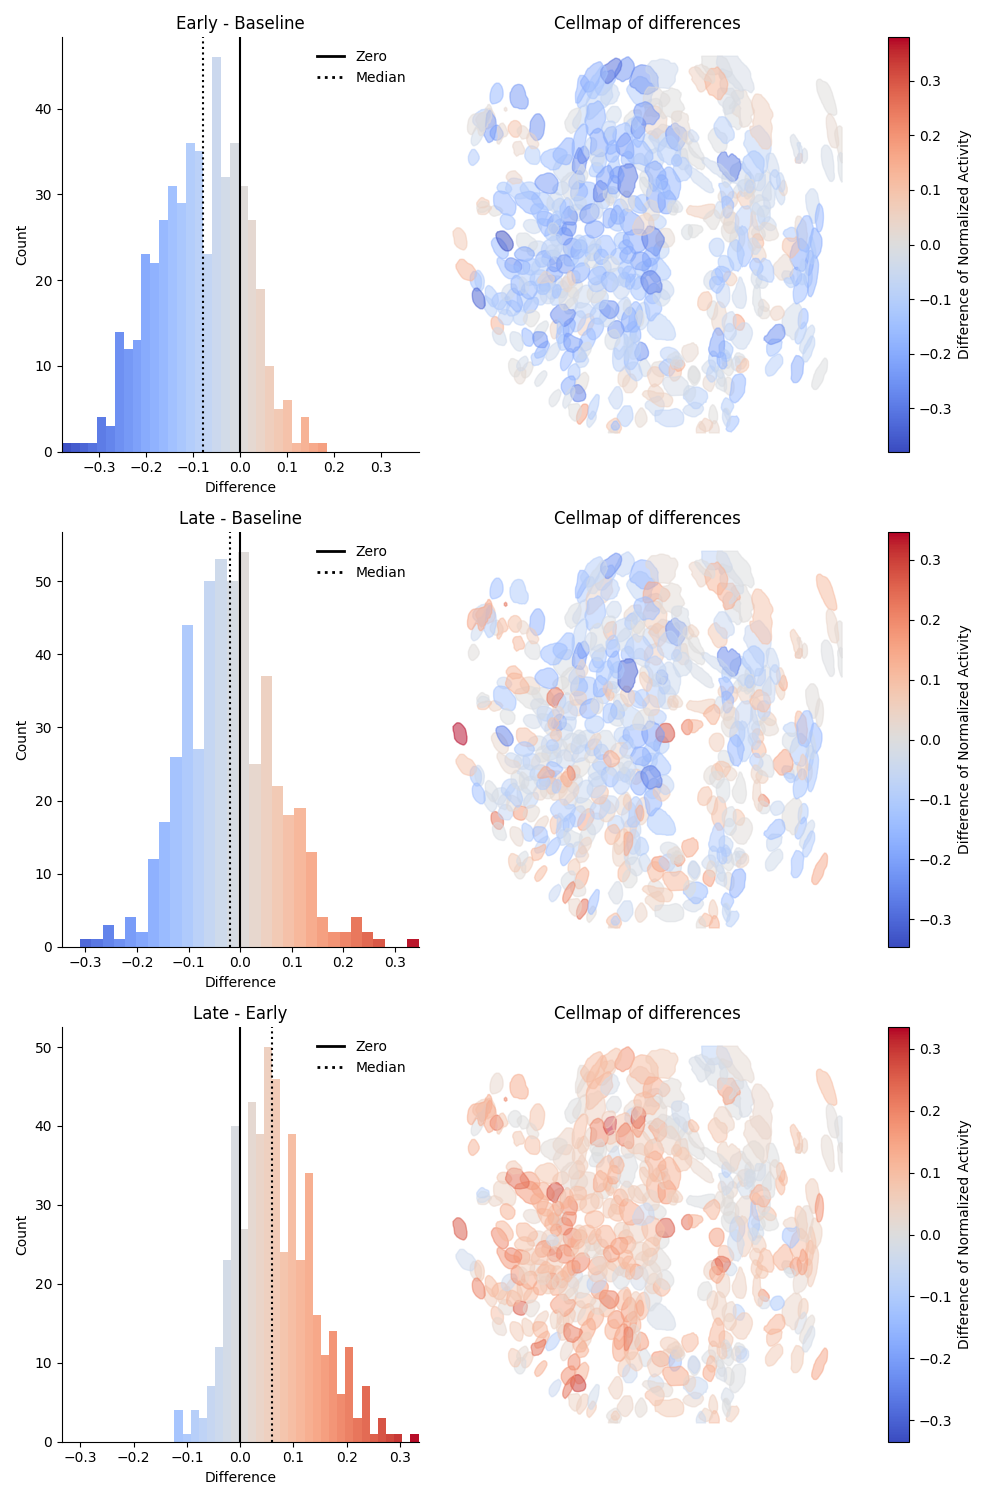
Epoch - Epoch differences preview
This preview shows the pairwise difference in event rate for each combination of epochs as rows. The difference is taken as Later Epoch - Earlier Epoch. The left column will show a histogram of the differences, colored by relative change. The median is indicated by a dotted black line. The right column will show a cell map of the cells in the population, with the cells colored by magnitude of relative change. On the far right is a colorbar mapping the relative change. Below is an example of the differences preview on standardized data:
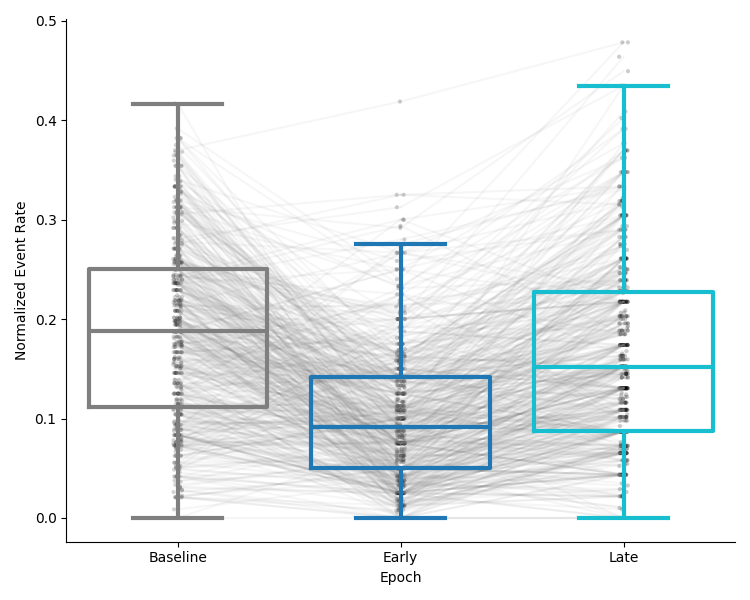
Calcium activity comparison
This preview will show a comparison of the average evenrate of the population of neurons in each epoch as a box and strip plot, with lines connecting the same cell in each epoch. The y-axis will show the average scaled event rate in each epoch.
Next steps
After running this tool, the outputs of this tool can be used as inputs to the Combine and Compare Neural Activity Across Epochs tool to compare the activity of multiple recordings together.