CaImAn Source Extraction
This tool uses 2.0 compute credits per hour.
Overview
The CaImAn source extraction tool is used to perform automated source extraction from calcium imaging movies using the CNMF/CNMF-E algorithm1 offered in the open-source package CaImAn2. The algorithm aims to retrieve the spatial location and temporal dynamics of individual neurons.
Inputs
The workflow supports individual movies and movie series. When a movie series is provided, the movies are concatenated temporally and analyzed as a single movie. When a movie series is processed, the number of output files will match the number of input files. For instance, for each input movie file, a corresponding output cell set file will be generated. While all output cell set files will contain the same spatial footprints, the temporal activity stored in each cell set file will match the timeline of the corresponding input movie.
Once the input movie is selected, an optional parameter file may be selected and used to override the parameters specified in the analysis table. The input files and processing parameters are listed in the table below.
Parameters
| Parameter | Required? | Default | Description |
|---|---|---|---|
| Movie(s) | True | N/A | Single movie file or movie series (isxd, tif, tiff, avi) |
| Optional Parameters File | False | N/A | JSON file containing CaImAn processing parameters |
| Overwrite Analysis Table Parameters | True | False | If True and a parameters file has been selected, the analysis table columns will be overwritten by the values contained in the parameters file. |
| fr | False | auto | Imaging rate in frames per second. If set to 'auto', the frame rate will be automatically determined based on file metadata. If no such metadata is available, CaImAn will default to 30 frames per second. |
| decay_time | False | 0.4 | Length of a typical calcium transient in seconds |
| dxy | False | 1.0 | Spatial resolution of the field of view in pixels per um |
| p | False | 1 | Order of the autoregressive model used to deconvolve the indicator temporal dynamics |
| K | False | auto | Number of components to be found per patch. If set to 'auto', the number of components will automatically be estimated. If 'rf' is unspecified (i.e. single patch), 'K' will correspond to the number of cells in the entire field of view. |
| gSig | False | 3 | Radius of an average neuron in pixels |
| gSiz | False | 7 | Half-size of the bounding box for each neuron |
| merge_thr | False | 0.7 | Trace correlation threshold for merging two components |
| rf | False | 40 | Half-size of a patch in pixels. If unspecified, the entire field of view will be processed as a single patch. |
| stride | False | 20 | Overlap between neighboring patches in pixels |
| tsub | False | 2 | Temporal downsampling factor |
| ssub | False | 1 | Spatial downsampling factor |
| method_init | False | corr_pnr | Method used for initializing cellular components. Use 'corr_pnr' for 1P data, 'greedy_roi' for 2P data, and 'sparse_NMF' for dendritic data. |
| min_corr | False | 0.85 | Minimum value of the correlation image for identifying a candidate component during 'corr_pnr' initialization |
| min_pnr | False | 12 | Minimum value of the peak-to-noise-ratio (pnr) image for identifying a candidate component during 'corr_pnr' initialization |
| ssub_B | False | 2 | Spatial downsampling factor to use when estimating the background activity during 'corr_pnr' initialization |
| ring_size_factor | False | 1.4 | Multiple of the radius of an average neuron (gSig) to use for computing the radius of the ring model used for estimating the background activity during 'corr_pnr' initialization |
| method_deconvolution | False | oasis | Method for solving the constrained deconvolution of temporal traces |
| update_background_components | False | True | If True, the spatial background components will be updated in each iteration of the algorithm |
| del_duplicates | False | True | If True, duplicate components in the overlapping regions between neighboring patches will be deleted. If False, a merging procedure will be used to determine whether the components are similar enough to be merged. |
| nb | False | 0 | Number of global background components. Set to 0 for 1P data. A default value of 1 may be used for 2P data. |
| low_rank_background | False | False | If True, the background will be updated using low-rank approximation. If False, all nonzero elements of the background components will be updated using the Hierarchical Alternating Least Squares (HALS) algorithm. Set to False for 1P data and True for 2P data. |
| nb_patch | False | 0 | Number of local background components per patch. Set to 0 for 1P data. A default value of 1 may be used for 2P data. |
| rolling_sum | False | True | If True, a rolling sum will be used for determining candidate centroids during 'greedy_roi' initialization. If False, a full sum will be used. |
| only_init | False | True | If True, the values after initialization will be returned |
| normalize_init | False | False | If True, pixel values will be normalized by their respective median intensity across the input movies |
| center_psf | False | True | If True, merge overlapping components by taking the best neuron. Set to True for 1P data and False for 2P data. |
| bas_nonneg | False | False | If True, a non-negative baseline will be used. If False, the baseline will be greater than or equal to the minimum value, which could be negative. |
| border_pix | False | 0 | Number of pixels to exclude around each border |
| refit | False | False | If True, the initial estimates will be refined by re-running the CNMF algorithm seeded on the spatial estimates from the previous step |
| n_processes | False | 7 | Number of processes used to analyze patches in parallel |
Optional Parameters File Format
A json file may be uploaded to IDEAS and used to specify CaImAn's processing parameters.
To override the analysis table parameters with the parameters specified in the json file supplied,
the Overwrite Analysis Table Parameters parameter must be set to True.
Sample parameter files from CaImAn are included below for reference.
Sample Parameters File
source_extraction_parameters.json
(additional example json files can be found in CaImAn's repository)
{
    "data": {
        "fr": 10,
        "decay_time": 0.4
    },
    "init": {
        "method_init": "corr_pnr",
        "K": null,
        "gSig": [3, 3],
        "gSiz": [13, 13],
        "ssub": 1,
        "tsub": 2,
        "nb": 0,
        "min_corr": 0.6,
        "min_pnr": 7,
        "normalize_init": false,
        "center_psf": true,
        "ssub_B": 2,
        "ring_size_factor": 1.4
    },
    "preprocess": {
        "p": 1
    },
    "temporal": {
        "p": 1,
        "method_deconvolution": "oasis"
    },
    "spatial": {
        "update_background_components": true
    },
    "patch": {
        "rf": 40,
        "stride": 20,
        "only_init": true,
        "nb_patch": 0,
        "low_rank_background": null,
        "del_duplicates": true
    },
    "merging": {
        "merge_thr": 0.7
    }
}
1P vs 2P Data Processing
The workflow is compatible with both 1P and 2P data.
The parameters that control the initialization step as well as how to model background fluctuations
can be adjusted based on the input data.
The default parameters are set for processing 1P data.
The table below summarizes the parameters that may be adjusted based on the desired workflow.
None means the parameter is unspecified and the corresponding analysis table cell is left empty.
Note that K must be set based on the expected number of components per patch for 2P data.
| Parameter | 1P | 2P |
|---|---|---|
| K | auto | 4 |
| method_init | corr_pnr | greedy_roi |
| del_duplicates | true | false |
| nb | 0 | 2 |
| low_rank_background | false | true |
| nb_patch | 0 | 1 |
| normalize_init | false | true |
| center_psf | true | false |
| bas_nonneg | false | true |
Outputs
The workflow will produce the outputs listed below.
CaImAn Output
hdf5 file containing the model and data produced by CaImAn.
This includes the model itself and the results of the algorithm, including cellular footprints,
temporal dynamics, spikes, noise estimates, background activity, residuals, and more.
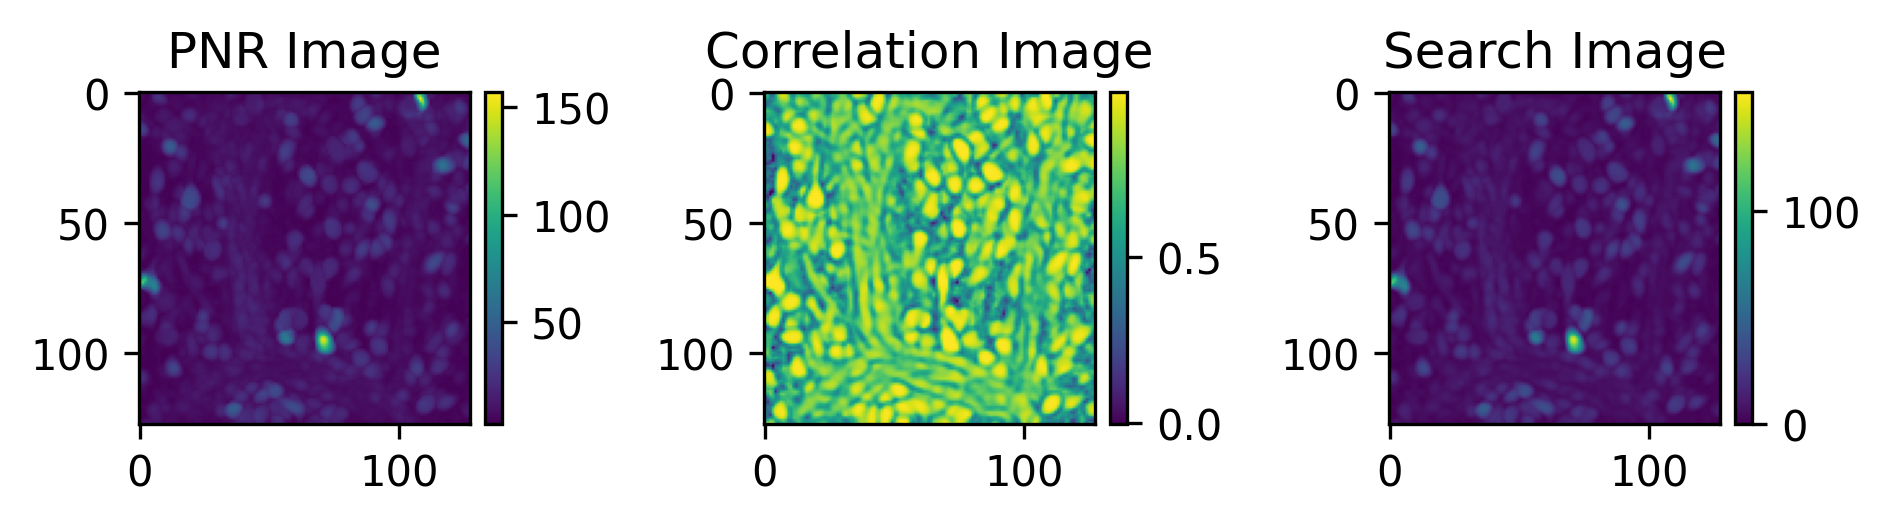
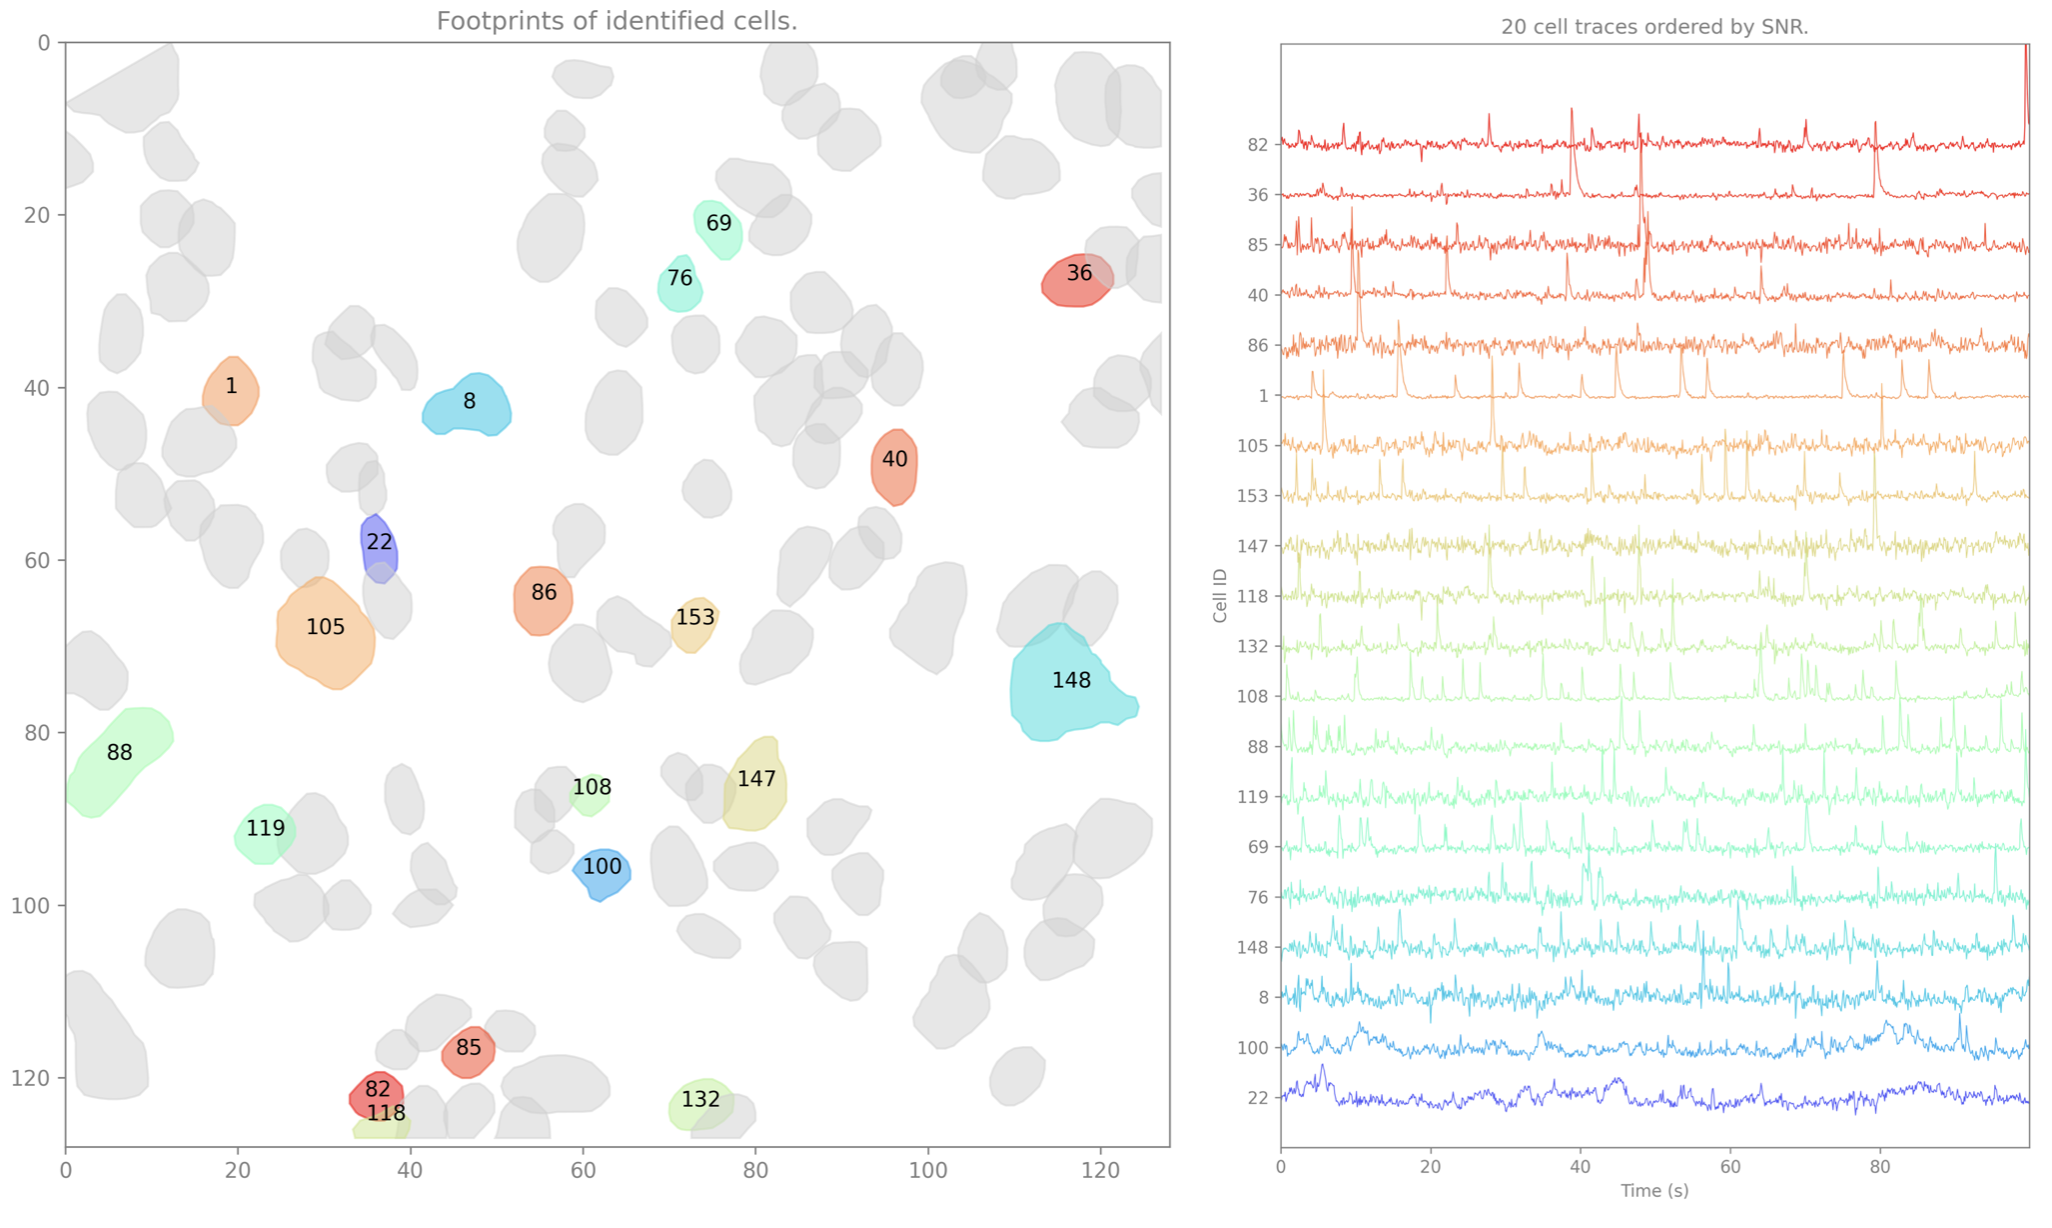
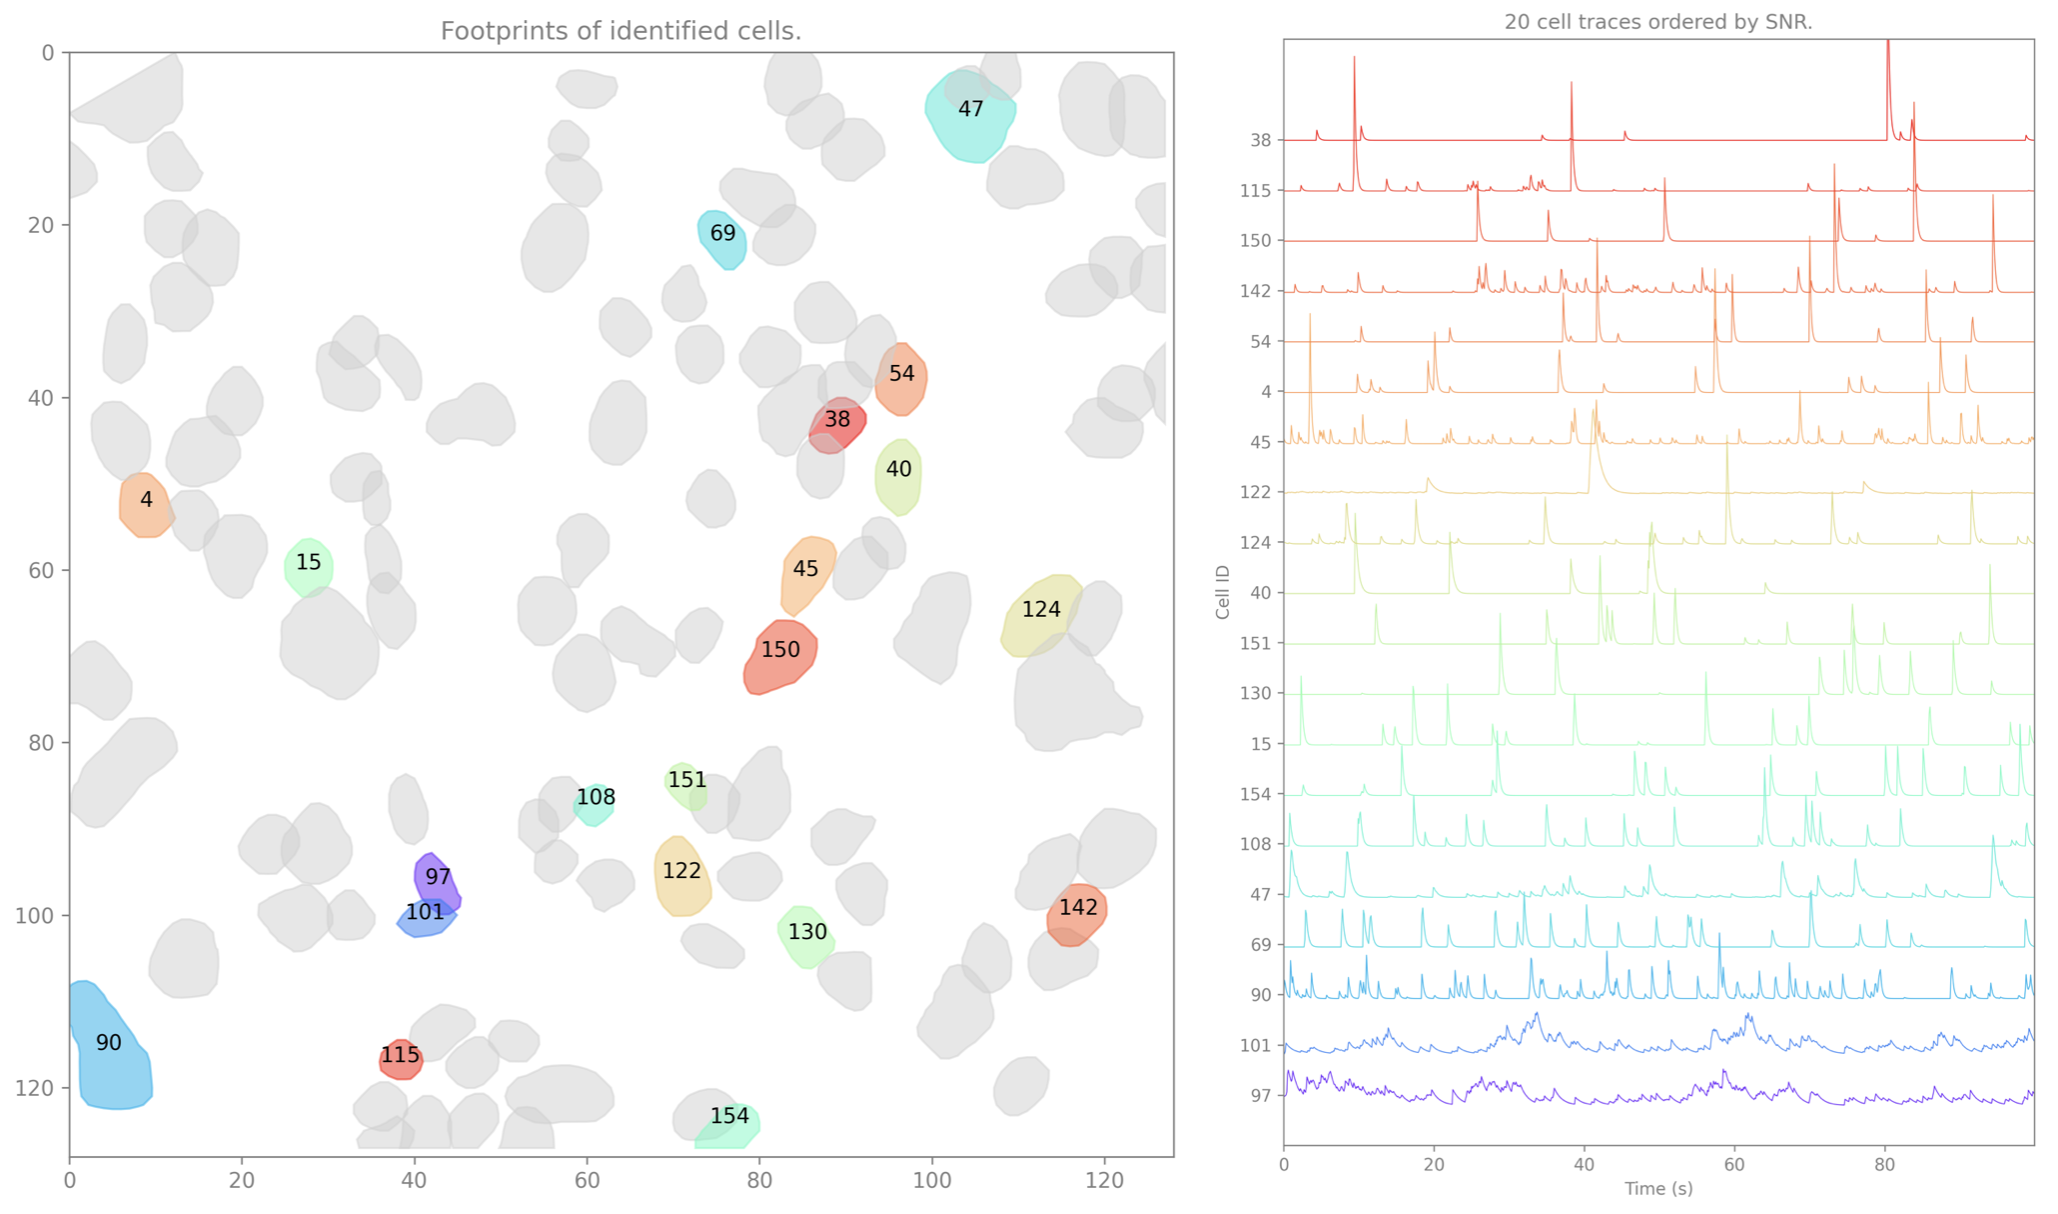
The data preview includes the initialization images used by the algorithm as well as the spatial footprints and raw temporal traces of putative cells detected by CaImAn.
Raw Cell Set(s)
isxd cell set(s) containing the spatial footprints and raw temporal traces of the cells identified by CaImAn.
Denoised Cell Set(s)
isxd cell set(s) containing the spatial footprints and denoised temporal traces of the cells identified by CaImAn.
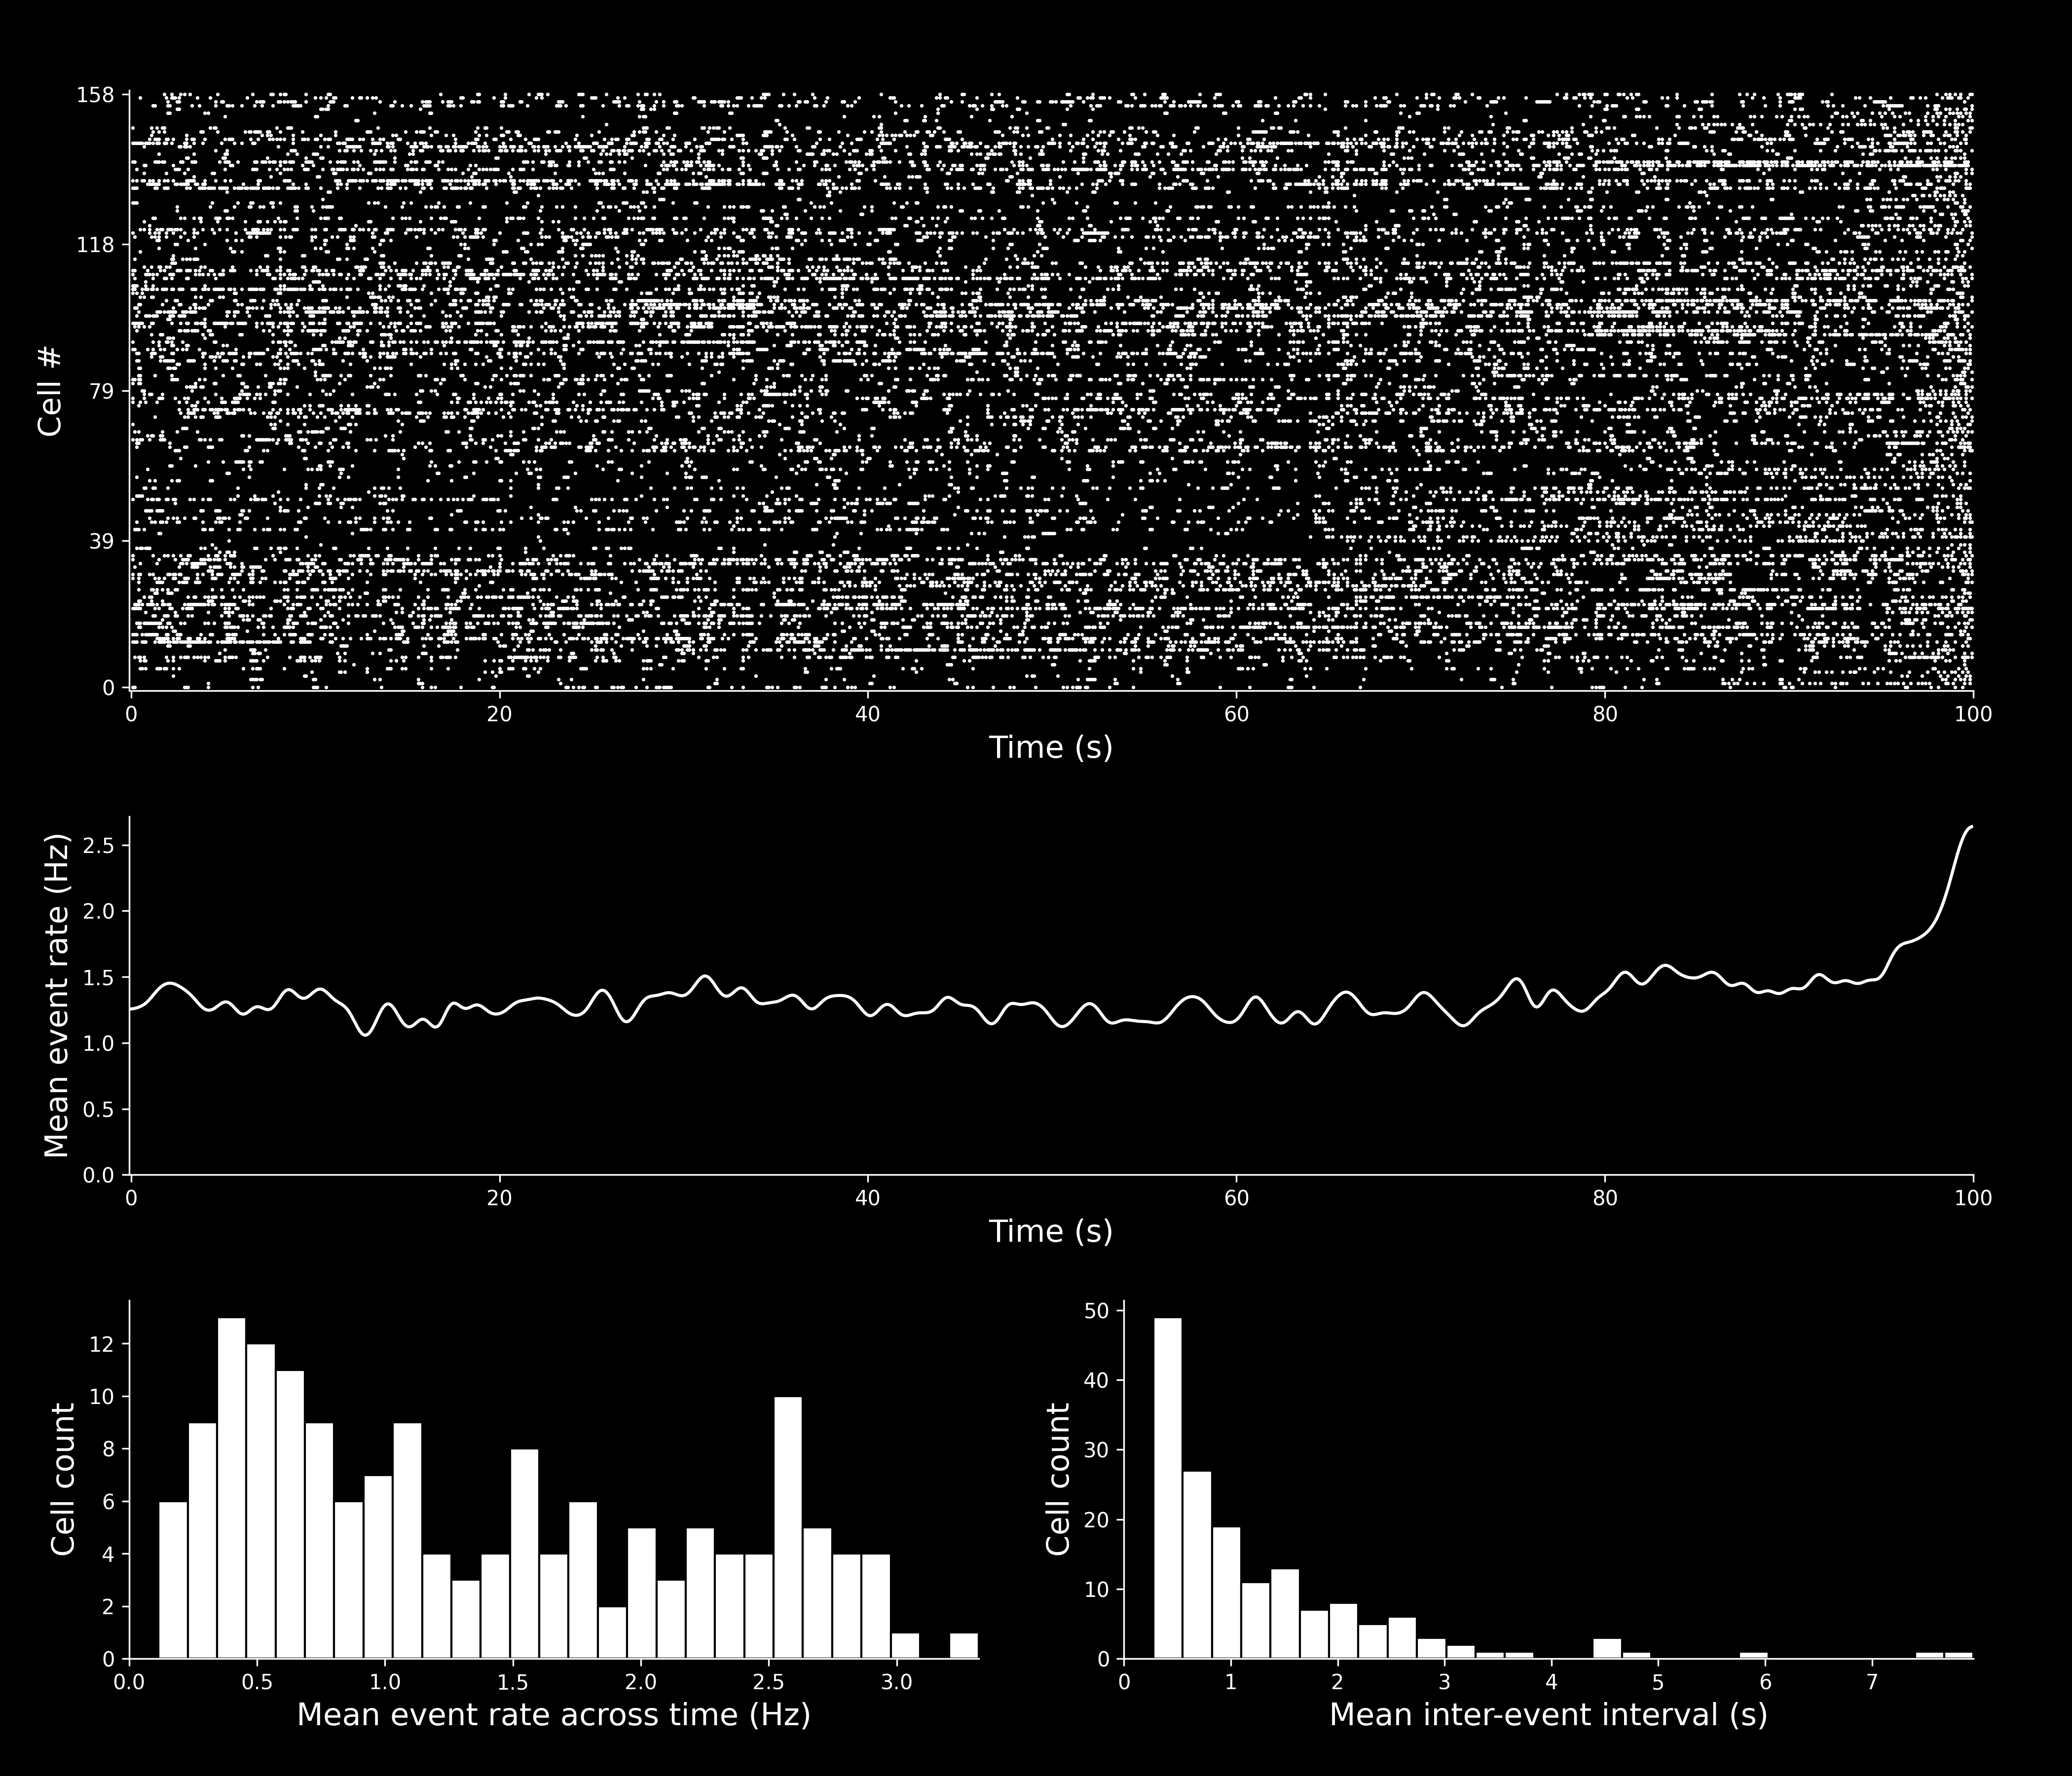
Spike Event Set(s)
isxd event set(s) containing the neural events identified by CaImAn.