This tool uses 1.0 compute credits per hour.
Zone Occupancy Analysis
This tool analyzes and summarizes zone occupancy based on the center of the tracked bounding box and user-defined zones to output the following metrics:
- Total Time in Zone: The cumulative time the subject spent in each zone, calculated from the number of frames spent in each zone.
- Zone area: Calculates the areas of the annotated zones within the FOV (Field of view).
- Occupancy Score: Occupation score is a metric that reflects zone preference independent of zone area1.
- Number of Zone Entries and exits: The number of times the subject entered and exited each zone.
- Length of Zone Occupancy Events: Duration of continuous periods of zone occupancy.
- Average Speed in Zone: The average speed of the subject in each zone.
- Instantaneous speed in zone: Calculated from the distance between consecutive keypoint estimates
New
Updates in version 3.0:
- Removed the Trajectory Preview output, adding it as a preview to the time_series_data.csv output.
- Added X and Y tracking point columns to the time_series_data.csv output.
- Zone occupancy will now only be computed if the zone column name is not provided, otherwise it will only use the zone column data.
- Re-ordered the zone column name parameter
- Corrected how the pixel to cm conversion is to the speed units.
Parameters
| Parameter | Required? | Default | Description |
|---|---|---|---|
| Tracking File | True | N/A | Experiment annotations file containing tracking coordinates |
| Zones File | True | N/A | A .CSV file describing zones of interest |
| X Column Name | True | Bounding Box Center X | The name of the x-coordinate column in the experiment annotations file |
| Y Column Name | True | Bounding Box Center Y | The name of the y-coordinate column in the experiment annotations file |
| Time Column Name | True | Frame Timestamp (s) | The name of the time column in the experiment annotations file |
| Unit of Time | False | seconds | The unit of time the data was sampled at |
| Zone Column Name | False | N/A | An optional parameter to specify if the tracking data contains a pre-defined zone identity column |
| Filter Speed | False | True | Flag indicating whether to apply a gaussian filter on the speed estimates |
| Speed Filter Kernel | False | 9 | This determines how many neighboring values are considered in the filtering process. it's usually an odd number (e.g., 3, 5, 7) to have a symmetrical filter |
| Speed Filter Size | False | 1 | The size of the gaussian filter to apply on the speed estimates. this is in units of standard deviation, also known as sigma |
| Pixels Per Cm | False | N/A | Number of pixels in a centimeter |
Details
Inputs
The tool expects two inputs.
The first input is a tracking.csv file, which is in the IDEAS experiment annotations format. This format requires annotations to be structured in a table with one time-point (i.e., frame) per row, and one or more columns for annotations (e.g., x and y). This tool expects the following columns:
- Tracking point X: The x coordinate of the center of the bounding box.
- Tracking point Y: The y coordinate of the center of the bounding box.
- Frame Timestamp: A time reference for each frame.
An example of a table that can be used as input to this tool is shown below:
| Frame Timestamp (s) | Bounding Box Center X | Bounding Box Center Y |
|---|---|---|
| 1.00 | 51.56 | 155.91 |
| 1.05 | 55.21 | 154.12 |
| 1.10 | 57.12 | 152.65 |
The second input is a zones.csv file, which is a table with one row per zone and columns for the zone name, and the zone vertices. The vertices can be specified as a list of x and y coordinates for each vertex, or as a center and major and minor axis for an ellipse. This tool expects the following columns:
- Name: The name of the zone.
- Type: The type of the zone, this will be
rectangle,polygon, orellipse. - X # and Y #: A series of columns representing the X coordinates of the zone. If the type is
ellipse, then the columns will beX 0,Y 0, for the centerpoint. If the type isrectangle, then the columns will beX 0,Y 0throughX 3,Y 3. If the type ispolygon, then the columns will beX 0,Y 0throughX n,Y n. - Major & Minor Axis: The major and minor axis diameters of the ellipse.
- Angle: The angle of the major axis of the ellipse.
An example of a table that can be used as input to this tool is shown below:
| Name | Type | X 0 | Y 0 | X 1 | Y 1 | X 2 | Y 2 | X 3 | Y 3 | X 4 | Y 4 | Major Axis | Minor Axis | Angle |
|---|---|---|---|---|---|---|---|---|---|---|---|---|---|---|
| Ellipse Zone | ellipse | 179.315 | 422.524 | 94.6154 | 19.6036 | 90 | ||||||||
| Rectangular Zone | rectangle | 78.4144 | 54.4471 | 471.629 | 54.4471 | 471.629 | 295.604 | 78.4144 | 295.604 | |||||
| Polygon Zone | polygon | 212.18 | 321.923 | 329.802 | 320.769 | 340.18 | 390 | 416.288 | 340.385 | 471.64 | 368.077 |
Valid tracking.csv and the zones.csv file can be generated from an .isxb file using Extract Tracking Data From nVision Movie.
Valid Inputs
| Source Parameter | File Type | File Format |
|---|---|---|
| Tracking File | experiment_annotations | csv |
| Zones File | movie_zones | csv |
Methodology
The tool calculates the following metrics:
Zone Occupancy detection
If no zone column name is provided, the tool will compute the zone occupancy using the Tracking point X and Y data.
At each frame, the tool will check the tracking XY coordinate against each zone.
- Polygons (including rectangle): The tool will check if the XY coordinate is within the polygon using the MatPlotLib's
contains_pointfunction - Ellipse: The tool will check if the XY coordinate is within the ellipse bounds using the Ellipse equation
Total Time in Zone
Total time for each zone is calculated by summing the number of frames spent in that zone.
Zone Area
Zone area is calculated for each zone the following way:
- Polygons (including rectangle): are calculated using the shoelace formula
- Ellipse: \(\pi \times \text{major axis} \times \text{minor axis}\)
Occupancy Score
Occupation score, also known as the enrichment score,1 is a metric that reflects zone preference independent of zone area. It is defined as the actual zone occupation / expected zone occupation. Where the expected zone occcupation is derived from the proportional area of the zone, the duration of the recording, and the assumption that all zones are visited with uniform probability. The occupation score for any given zone is calculated as follows:
Occupation scores greater than 1 represent zone preference higher than if the subject spent uniform time in every zone relative to its area.
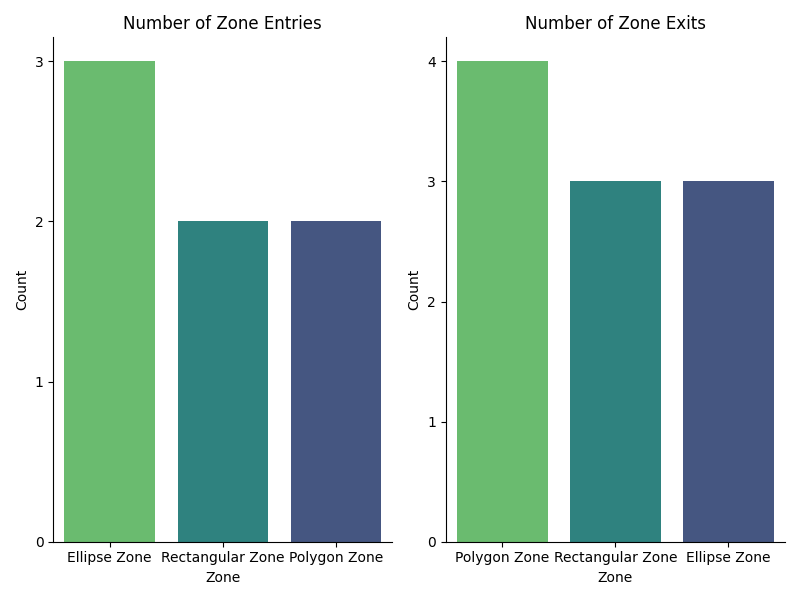
Number of Zone Entries and exits
The number of times the subject entered or exited each zone.
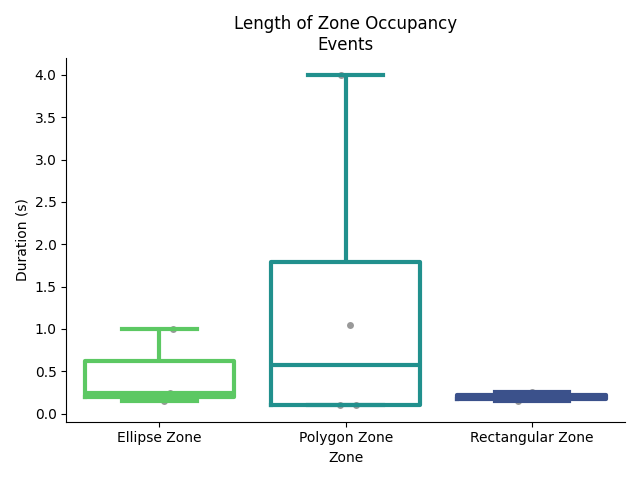
Length of Zone Occupancy Events
The length of continuous periods for each zone.
Instantaneous Speed Calculation
Instantaneous speed is calculated from keypoint estimates by computing the Euclidean distance between consecutive tracking coordinates and dividing by the time difference between consecutive frames. If the Pixels Per Cm parameter is specified, then the speed is converted from px/s to cm/s.
Outputs
Zone Summary
The summary table is a .csv file which contains the results of the zone occupancy analysis. An example of a zone summary table is shown below:
| Zone Name | Total Time Spent (s) | Zone Area (Square Pixels) | Occupancy Score | Number of Entrances | Average Duration (s) | Number of Exits | Average Speed (cm/s) |
|---|---|---|---|---|---|---|---|
| Ellipse Zone | 1.549 | 1456 | 4.629 | 3 | 0.466 | 3 | 1191.544 |
| Rectangular Zone | 0.549 | 94826 | 1.391 | 2 | 0.199 | 3 | 1475.982 |
| Polygon Zone | 5.249 | 19046 | 0.029 | 2 | 1.314 | 4 | 2292.748 |
Zone Summary Previews
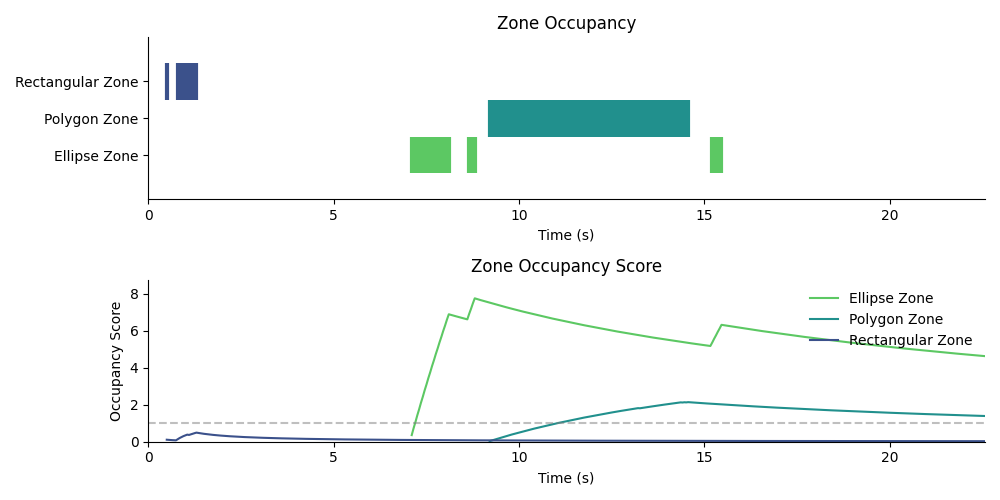
Zone Occupancy Overview:
Summary of subject zone occupancy. Top panel shows zone occupation as a function of time. Bottom panel shows occupancy score as a function of time.
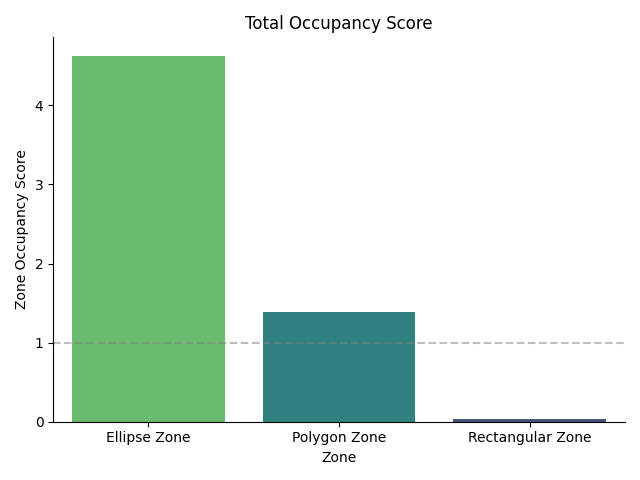
Total Occupancy Score:
The cumulative occupancy score across the entire session.
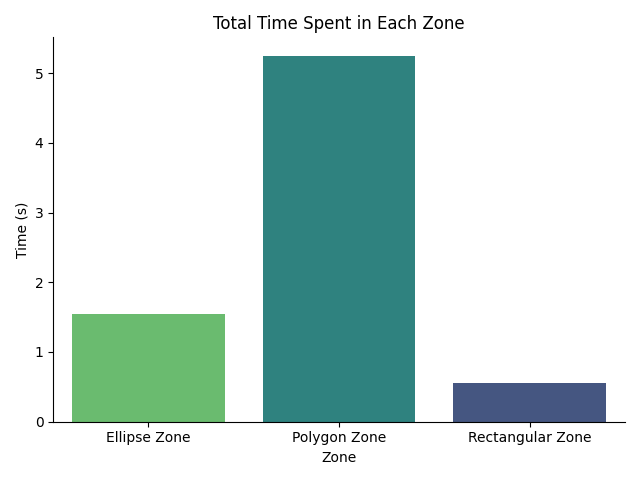
Total Time Spent in Each Zone:
The cumulative time (in seconds) the subject spent in each zone
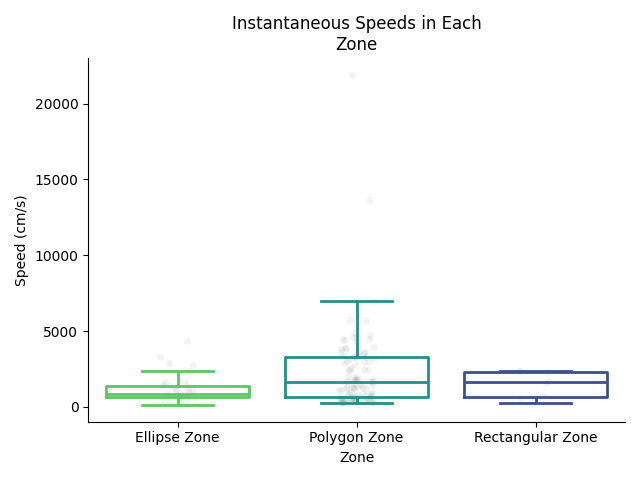
Instantaneous Speeds:
Box plots with strip plot overlaid showing the distributions of instantaneous speeds for each zone. Each dot represents an instantaneous speed computed from a single time point.
Number of Zone Entries:
Summary showing the number of times the subject entered each zone.
Zone Events
The Events table is a .h5 in the event time stamps format and returns the timestamps of zone entries and exits.
An example of the table is shown below:
| Event Name | Time |
|---|---|
| Rectangular Zone exit | 0.500007 |
| Rectangular Zone entrance | 0.799999 |
| Rectangular Zone exit | 1.299994 |
| Ellipse Zone entrance | 7.107993 |
| Ellipse Zone exit | 8.107995 |
| Polygon Zone entrance | 9.207992 |
| Polygon Zone exit | 13.212001 |
| Polygon Zone entrance | 13.311996 |
| Polygon Zone exit | 14.363993 |
| Polygon Zone exit | 14.463991 |
| Polygon Zone exit | 14.564001 |
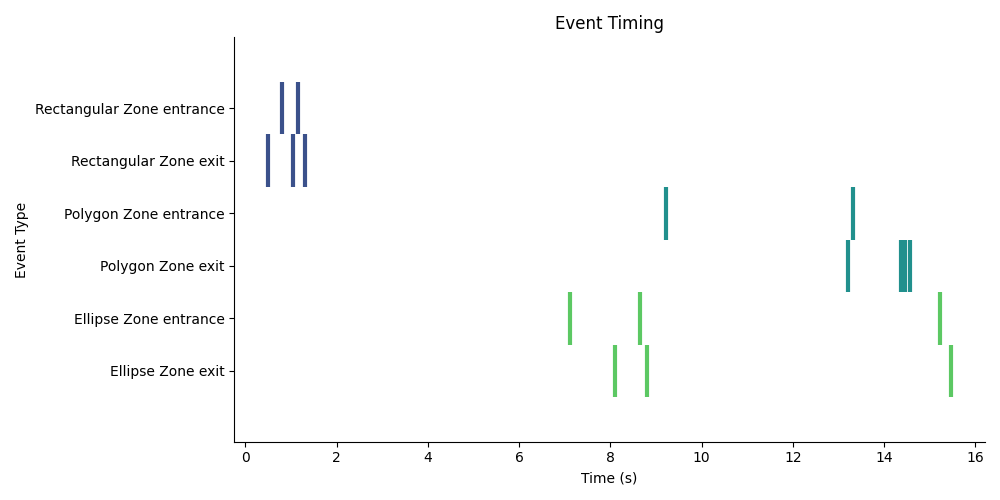
Zone Events Previews
Event Periods:
Raster plot of event entrance and exit timings for each zone. Each row represents a unique zone event, and each dot represents an event.
Length of Zone Occupancy Events:
Box plots with strip plot overlaid showing the distribution of durations the subject spent continuously in each zone. Each dot represents a single period.
Time Series Results
The speed table is a .csv in the experiment annotations format and returns the instantaneous speed for each frame. Some example rows from an output are shown in the table below:
| Frame Timestamp (s) | Bounding Box Center X | Bounding Box Center Y | Zone Name | Speed (cm/s) | Occupancy Score in Ellipse Zone | Occupancy Score in Polygon Zone | Occupancy Score in Rectangular Zone |
|---|---|---|---|---|---|---|---|
| 0.85 | 123 | 456 | Rectangular Zone | 2317.56 | 0.20 | ||
| 0.90 | 234 | 345 | Rectangular Zone | 2342.35 | 0.25 | ||
| 0.95 | 345 | 234 | Rectangular Zone | 1552.60 | 0.30 | ||
| 1.00 | 456 | 123 | Rectangular Zone | 696.97 | 0.34 | ||
| 1.05 | 100 | 200 | Rectangular Zone | 594.47 | 0.38 | ||
| 7.11 | 200 | 100 | Ellipse Zone | 2369.80 | 0.36 | 0.09 | |
| 7.16 | 150 | 250 | Ellipse Zone | 1099.39 | 0.71 | 0.09 | |
| 7.21 | 250 | 150 | Ellipse Zone | 699.92 | 1.06 | 0.09 | |
| 7.26 | 300 | 350 | Ellipse Zone | 870.77 | 1.41 | 0.09 | |
| 7.31 | 350 | 300 | Ellipse Zone | 687.61 | 1.76 | 0.09 | |
| 7.36 | 400 | 500 | Ellipse Zone | 214.24 | 2.10 | 0.09 |
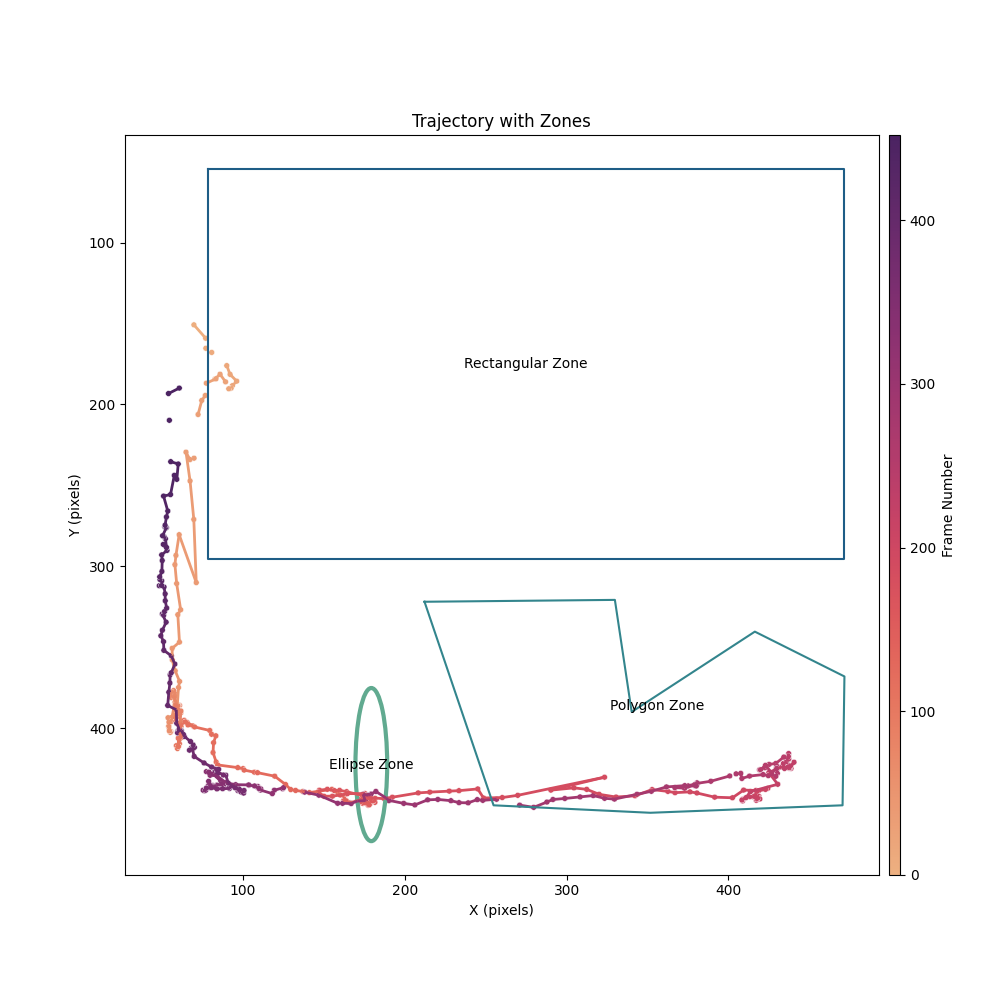
Trajectory With Zones Preview
Preview showing the trajectory of the subject overlaid with the zones. The zones are shown in different colors.
Time Series Results Previews
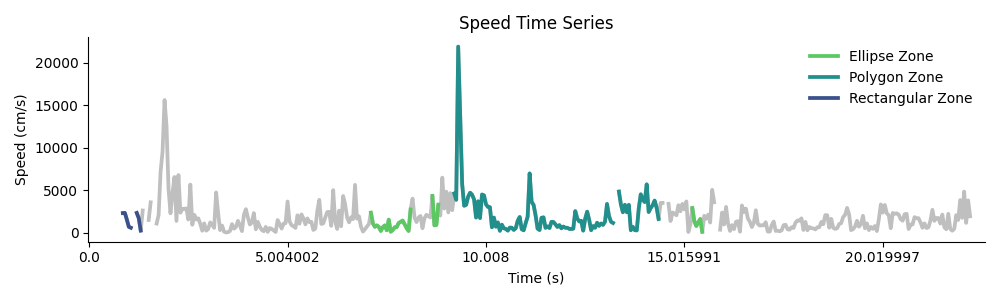
Speed Time Series:
A plot of the instantaneous speed as a function of time. The colored sections of the line represent different zone occupancy.
Instantaneous Speeds:
Box plots with strip plot overlaid showing the distributions of instantaneous speeds for each zone. Each dot represents an instantaneous speed computed from a single time point.
Next Steps
After running this tool, the outputs of this tool can be used as inputs to other tools.
The zone_events.h5 output can be used to compare neural activity surrounding zone events using:
The time_series_data.csv can be synchronized to a corresponding .isxd file using Map Annotations To ISXD Data, which can then be used as input to the following tools to observe differences in neural activity in different zones:
FAQ
Q: When should I include the zone column name?
A: The zone column name parameter should be included when the user wants to analyze the zone occupancy based on pre-computed zone occupancy labels already present in the input annotations tracking file. Example situations could be 1) if you used IDAS nVision real-time tracking and zone occupancy detection for closed loop stimulation, and want to exactly match the zone occupancy labels with the closed-loop stimulation timings, or 2) if you used manual annotations to track the zone occupancy on a recording with noise trajectory estimates.
Q: Are there any differences between the Zone Name label output by nVision Animal Tracking Model and the Zone Name label output by this tool?
A: The Zone Name label output by nVision Animal Tracking Model include two differences. First, at the beginning of a recording there may be a delay of 250-300 ms where the nVsison zone occupancy labels cannot be assigned. Second, the nVision Animal Tracking Model algorithm will mark exit events with an additional frame of zone occupancy, which is required for closed loop triggers.
Previous Changelogs
Updates in version 2.0:
- Fixed an issue where the tool expected specifically named columns associated with the outputs from nVision tracking. The tool now asks for the user to specify the columns associated the zone name, the frame timestamp, and the time unit associated with the timestamp.
- The tool will now compute the zone occupancy if no zone column name is provided.
- The tool now outputs a preview image of the trajectory and zones overlaid on the FOV.
- Improved figure clarity
- Fixed a bug where some durations were calculated incorrectly.