Compare Peri-Event Activity Across Epochs
This tool uses 1.0 compute credits per hour.
Overview
The Compare Peri-Event Activity Across Epochs tool quantifies and compares how neural signals
vary before and after event timestamps across a number of epochs.
The analysis performed for each epoch consists in applying the Peri-Event Analysis Workflow
on a temporal subset of the input data defined by the specified epoch periods.
The analysis computes the change in neural activity of both the entire population of
neurons and each individual neuron, classifying them into up-modulated, down-modulated, or non-modulated sub-populations.
The peri-event change in activity (Δ activity) is computed by taking the difference between the post-event and pre-event activity.
The peri-event change in activity is compared between each pair of epochs to identify potential differences across the epochs.
Inputs
Files
The analysis requires a cell set and corresponding timestamp events. In the context of this analysis, each event corresponds to a single time point. Event files supported by this tool can be generated using Convert CSV File to Events or Detect Events from GPIO Data.
| Source Parameter | File Type | File Format |
|---|---|---|
| Cell Set(s) | cell_set | isxd |
| Events | timestamp_events | h5 |
Parameters
| Parameter | Required? | Default | Description |
|---|---|---|---|
| Cell Set(s) | True | N/A | Select cell sets to use for analysis |
| Events | True | N/A | Select event data to use for analysis |
| Define epochs by | True | global file time | Method to define epochs. If 'files' is selected, one epoch will automatically be defined for each input cell set file, matching the start and end time of the corresponding files. When 'global file time' is selected, an arbitrary number of epochs can be defined under the 'Epoch periods' columns by specifying the start and end time of each epoch in seconds relative to the start time of the first cell set. Example: (0,10),(11,20). When 'local file time' is selected, an arbitrary number of epochs within each cell set file can be defined by specifying the start and end time of each epoch in seconds relative to the start time of the corresponding cell set. Example: [(0, 10)], [(0,20),(30,50)] |
| Epoch names | True | N/A | Comma-separated list of epoch names (e.g. Epoch 1, Epoch 2, Epoch 3) |
| Epoch periods | False | N/A | Comma-separated list of tuples containing the start and end times (in seconds) of each epoch (e.g. (0, 10), (11, 20), (21, 30)). This parameter will be ignored when 'Define epochs by' is set to 'files'. |
| Epoch colors | True | N/A | Comma-separated list of matplotlib compatible colors to represent each epoch (e.g. grey, blue, cyan) |
| Minimum number of events | True | 1 | Minimum number of events per epoch. Epochs for which the number of events is below the specified value will be excluded from the analysis. |
| Event type | True | N/A | Select type of event to analyze from the column names of the event file |
| Statistical window (pre, start) | True | -1 | Start of time window in seconds before each event to use for statistical tests |
| Statistical window (pre, end) | True | 0 | End of time window in seconds before each event to use for statistical tests |
| Statistical window (post, start) | True | 0 | Start of time window in seconds after each event to use for statistical tests |
| Statistical window (post, end) | True | 1 | End of time window in seconds after each event to use for statistical tests |
| Number of random shuffles | True | 1000 | Number of random shuffles of event times to perform for constructing null distribution |
| Significance threshold | True | 0.05 | p-value threshold for classifying neurons as up- or down-modulated |
| Seed | True | 0 | Seed for the random generator used to shuffle event indices |
| Comparison Type | True | two_tailed | Type of statistical test to perform |
| Temporal downsampling factor | True | 1 | Temporal downsampling factor to apply to the activity traces before running the peri-event analysis |
| Visual window (pre) | True | -2 | Time in seconds to visualize before each event in output figures (not used for statistics) |
| Visual window (post) | True | 2 | Time in seconds to visualize after each event in output graphs (not used for statistics) |
| Population activity (y-axis range) | False | auto | y-axis range (z-score) applied to the event-aligned population activity plots specified as 'min,max' (e.g. -1,1) or 'auto' |
| Activity heatmap (colormap range) | False | auto | Colormap range (z-score) applied to the activity heatmaps specified as 'min,max' (e.g. -1,1) or 'auto' |
| Activity by modulation group (y-axis range) | False | auto | y-axis range (z-score) applied to the event-aligned activity by modulation plots specified as 'min,max' (e.g. -1,1) or 'auto' |
| Modulation colors | False | green,blue,black | Comma-separated list of matplotlib compatible colors representing the up-, down- and non-modulated neurons, respectively |
| Activity heatmap colormap | False | coolwarm | Colormap applied to the activity heatmaps (must be matplotlib compatible) |
Epoch Definitions
This section describes how epochs can be defined and specified for analysis.
An epoch is a period of time that is defined by a start time, an end time, and a name. A color is also assigned to each epoch.
An epoch period represents the start and end time of an individual epoch as a tuple (start, end).
A comma-separated list of such tuples can be entered in the Epoch periods parameter to define the individual epochs.
The chosen epoch definition will determine how the algorithm interprets the specified epoch periods.
The table below summarizes how epochs can be defined and the corresponding format to use when specifying epoch periods.
| Epoch Defined By | Description | Example Epoch Periods |
|---|---|---|
| files | One epoch will automatically be defined for each input cell set file. The start and end time of each epoch will match the start and end time of the corresponding cell set file. | No epoch periods need to be specified under this definition. The Epoch periods field is ignored when defining epochs by files. |
| global file time | Under this definition, the overall timeline is obtained by combining the duration of the input recordings together. For instance, if there are two input cell sets, each with a duration of 10 seconds, the total duration would be 20 seconds. An arbitrary number of epochs can be defined by specifying the start and end time of each epoch in seconds relative to the start time of the first cell set, i.e. 0 seconds. The epochs are specified as a comma-separated list of (start, end) tuples as shown in the example on the right. |
(0,10), (11,20) In this example, two epochs are defined. The first epoch consists of the first 10 seconds while the second epoch starts 11 seconds after the start of the first recording and ends at 20 seconds. |
| local file time | Under this definition, epochs are defined independently for each input cell set file. An arbitrary number of epochs within each cell set file can be defined by specifying the start and end time of each epoch in seconds relative to the start time of the corresponding cell set. Square brackets [ ... ] are used to represent each file and encapsulate a list of comma-separated (start, end) tuples defining the epochs within the corresponding files. An example is provided on the right. |
[(0, 10)], [(0,20), (30,50)] In this example, three epochs are defined. The first epoch consists of the first 10 seconds of the first input cell set file. The second epoch consists of the first 20 seconds of the second input cell set file. The third epoch consists of the time period starting 30 seconds after the start time of the second recording and ending at 50 seconds relative to the start of that same recording. |
Algorithm Description
For each epoch, the peri-event analysis workflow is applied onto
the corresponding time period by limiting the analysis to the events contained within the epoch timeline.
If a single epoch is specified, the output will match the peri-event analysis workflow applied to a temporal
subset of the data defined by the epoch period. No epoch comparison data will be generated.
If multiple epochs are analyzed, the mean post-pre activity between each pair of epochs will be statistically compared.
The pairwise comparisons are made using the pingouin.pairwise_tests function from the pingouin package.
Outputs
Data
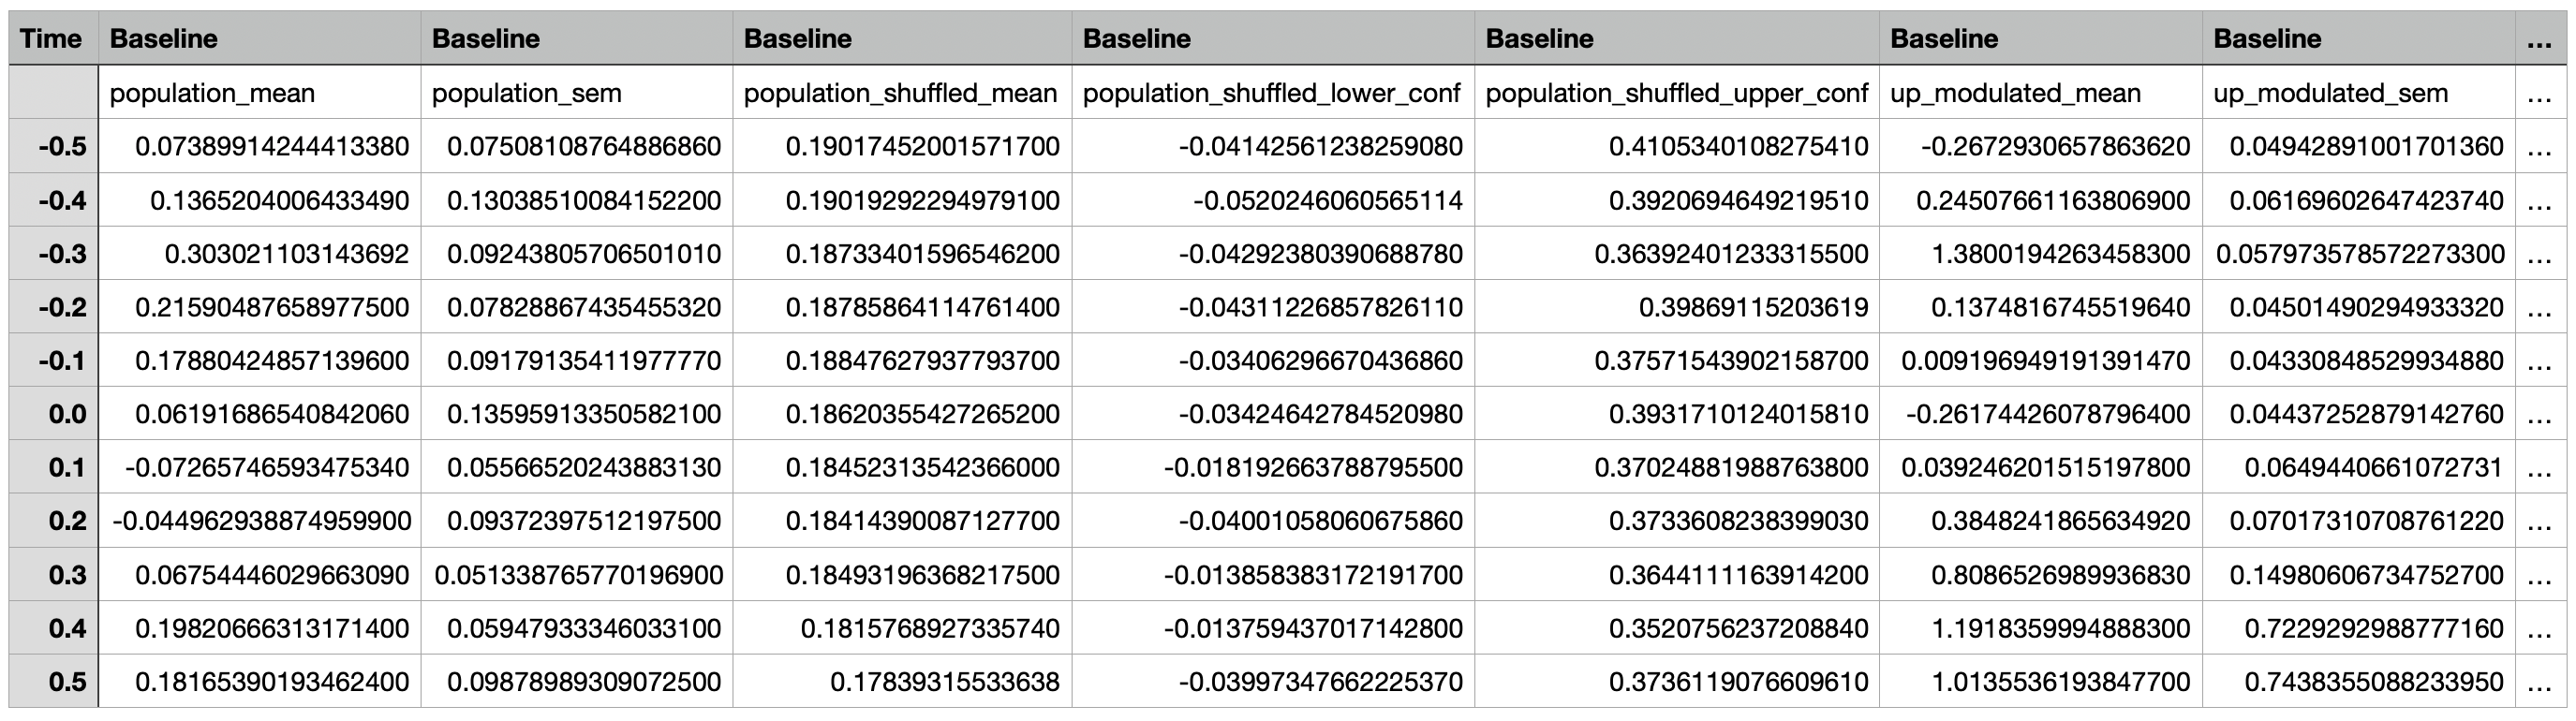
Event-Aligned Activity
A csv file containing the event-aligned traces for the population, subpopulations (up modulated, down modulated, non modulated), and individual cells for each epoch.
The first two rows consist of column headers. With the exception of the Time column, the first row contains the epoch names
while the second row contains the name of the traces.
The Time column represents the time points relative to the event time in seconds, with 0 representing the event time,
negative numbers representing time points before the event, and positive numbers representing timepoints after the event.
The other columns contain the mean neural activity around an event and the corresponding standard error of the mean
for individual cells, subpopulations (up modulated, down modulated, non modulated), and the overall population.
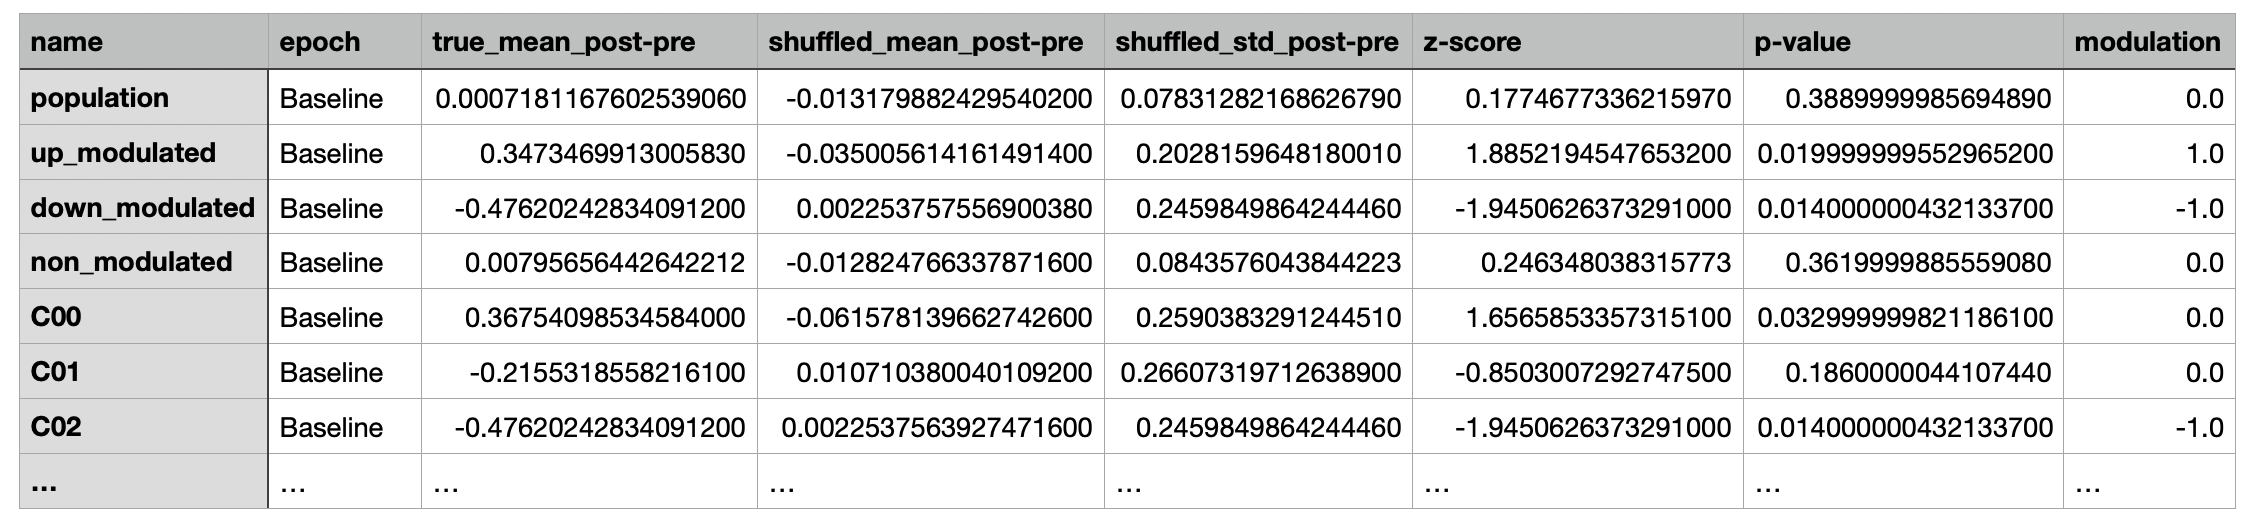
Statistics of Event-Aligned Activity
A csv file containing the peri-event change in activity (post-pre), modulation, and the corresponding statistical metrics
for the population, subpopulations (up modulated, down modulated, non modulated), and individual cells for each epoch.
Each row contains data for a given cell, subpopulation, or population within the epoch specified under the epoch column.
The columns contain the measurements and statistical metrics computed.
Pairwise Comparisons Between Epochs
A csv file containing the differences between each pair of epochs and the corresponding statistical metrics.
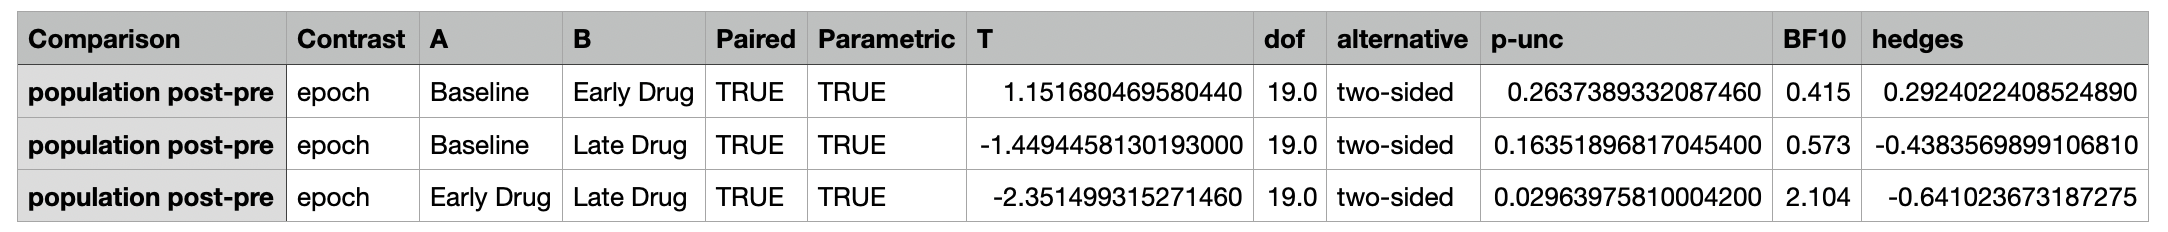
The individual columns are described below:
| Column Name | Description |
|---|---|
| Comparison | The metric being compared |
| Contrast | The type of contrast being made |
| Epoch | The epoch being compared |
| A | The first group being compared |
| B | The second group being compared |
| Paired | Whether the comparison is paired |
| Parametric | Whether the comparison is parametric |
| T | The t-statistic |
| dof | The degrees of freedom |
| alternative | The alternative hypothesis |
| p-unc | The uncorrected p-value |
| BF10 | Bayes Factor of the alternative hypothesis |
| hedges | Hedges g effect size |
Figures
Mean Population Activity

The mean population activity plotted over time is obtained by averaging the z-scored neural activity across all neurons (black trace). Shaded areas represent the different epochs. Individual events are displayed as grey dots underneath the population activity trace. When processing a cell set series, black vertical dashed lines are added to delimit the individual cell sets.
Event-Aligned Population Activity

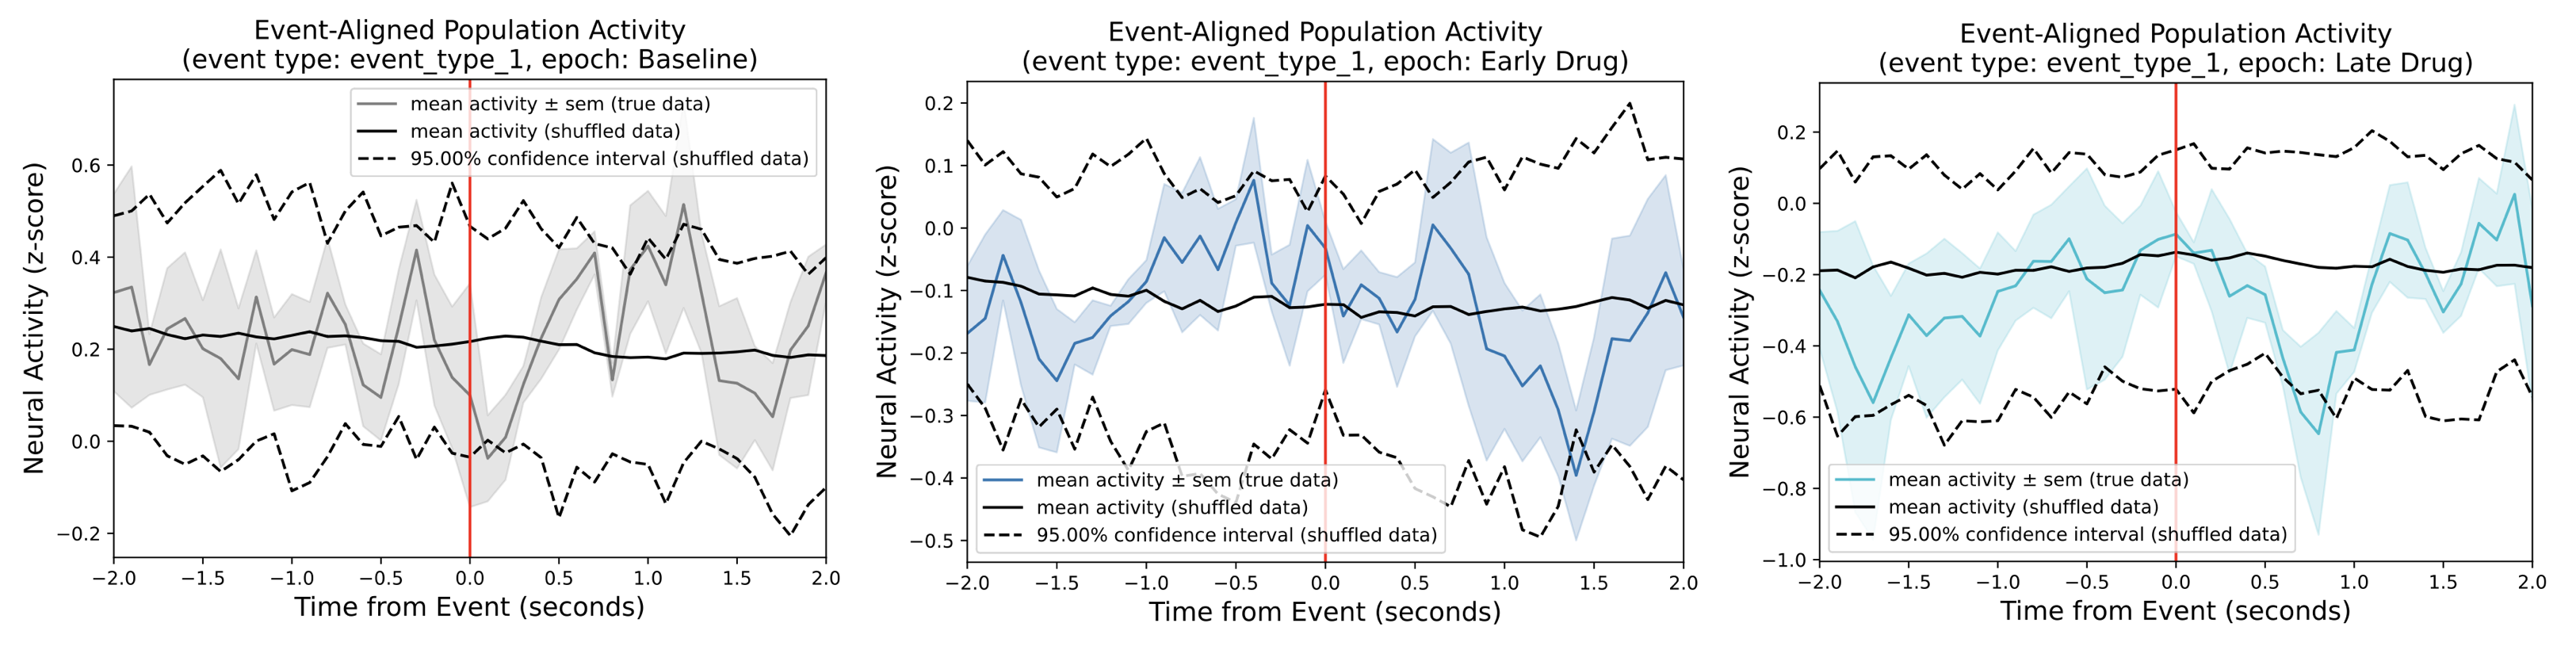
These plots provide information about the average z-scored neural activity
for all neurons in each epoch (grey, blue, and cyan traces) around an event (red vertical line).
Specifically, the colored lines represents the mean signal in each epoch and the shaded regions
represent the corresponding standard error of the mean (SEM).
The top panel compares the event-aligned population across the epochs while the bottom three panels
isolate the event-aligned population activity within each epoch in their own figure.
The two black lines shown in the bottom three panels represent the confidence interval of the null distribution
obtained from the circular permutation test using shuffling,
and is dictated by the significance threshold parameter.
Event-Aligned Single-Cell Activity Heatmaps

This plot shows the z-scored neural activity for each neuron in the field of view around an event (red vertical line). Warmer colors represent higher activity and cooler colors represent lower activity. The cells are sorted based on modulation, with the up-modulated cells at the top of the heatmap and the down-modulated cells at the bottom of the plot. This plot captures the heterogeneity of signal, which can be difficult to deduce from the analysis of pooled neural signals. One heatmap plot is generated for each epoch.
Event-Aligned Subpopulation Activity

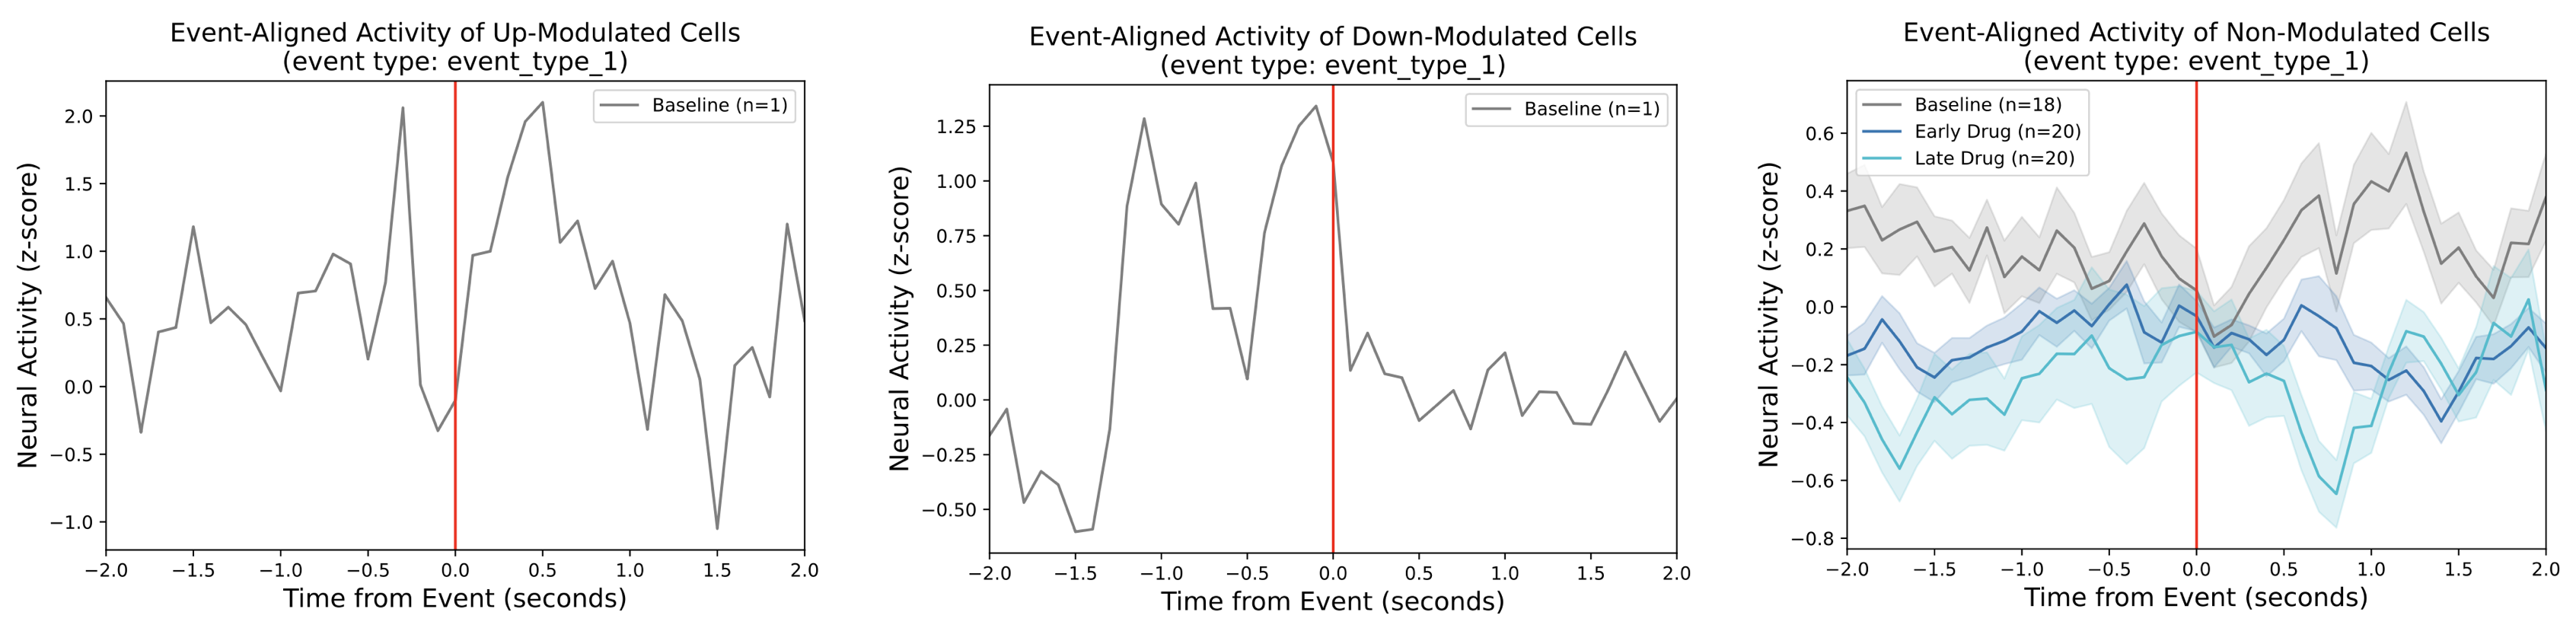
The top panel shows the average neural activity of the subpopulations of up-modulated (green), down-modulated (blue), and non-modulated (gray) neurons around an event (red vertical line). The lines correspond to the mean within each subpopulation and the shaded regions represent the standard error of the mean (SEM). One such figure will be generated for each epoch.
The bottom three panels compare the event-aligned activity around an event across the epochs for the up-modulated (left), down-modulated (middle), and non-modulated cells (right). If there are no modulated cells in a given epoch, no trace will be shown for the corresponding subpopulation. If there are no modulated cells across all epochs, the corresponding subpopulation figure will not be generated.
Cell Maps

Cell map showing the spatial organization of cells within the field of view. Cells are colored based on their modulation group (up-, down-, and non-modulated). One cell map is generated for each epoch.
Number of Modulated Cells Per Epoch

Bar chart showing the number of up-, down-, and non-modulated cells in each epoch.
Number of Events Per Epoch

Bar chart showing the number of events in each epoch.
Mean Post-Pre Activity Per Epoch

Bar chart comparing the mean post-pre activity change across the epochs. The error bars represent the standard error of the mean.
Pairwise Comparison of Post-Pre Activity Across Epochs

Pairwise difference of post-pre activity between epochs. The left panel presents the data as a histogram. The right panel contains a cell map colored by the magnitude of the difference in post-pre activity between the epochs. One figure will be generated for each pair of epochs.
Distribution of Post-Pre Activity Per Epoch

Distribution of post-pre activity across epochs displayed using a box plot. Lines connect the same cells together.
Next Steps
After running this tool, the outputs can be used as input to the Combine and Compare Peri-Event Data Across Epochs tool.