Manual ROIs
This tool uses 0.5 compute credits per hour.
The Manual Regions of Interest (ROIs) operation allows you to manually draw contours on a microscope movie in order to measure the activity inside each region.
This can be used to get a sense of the activity in the movie, or can be used to measure cell activity when the movie only contains a few non-overlapping cells. If the movie contains many cells that spatially overlap, consider using an automatic cell identification algorithm such as PCA-ICA or CNMF-E instead.
Inputs
| Parameter | Required? | Default | Description |
|---|---|---|---|
| Input Movies Files | True | N/A | path to the input isxd movie files |
| ROIs | True | N/A | Manually drawn rois |
File Inputs
| Source Parameter | File Type | File Format |
|---|---|---|
| Input Movies Files | miniscope_movie | isxd |
ROIs
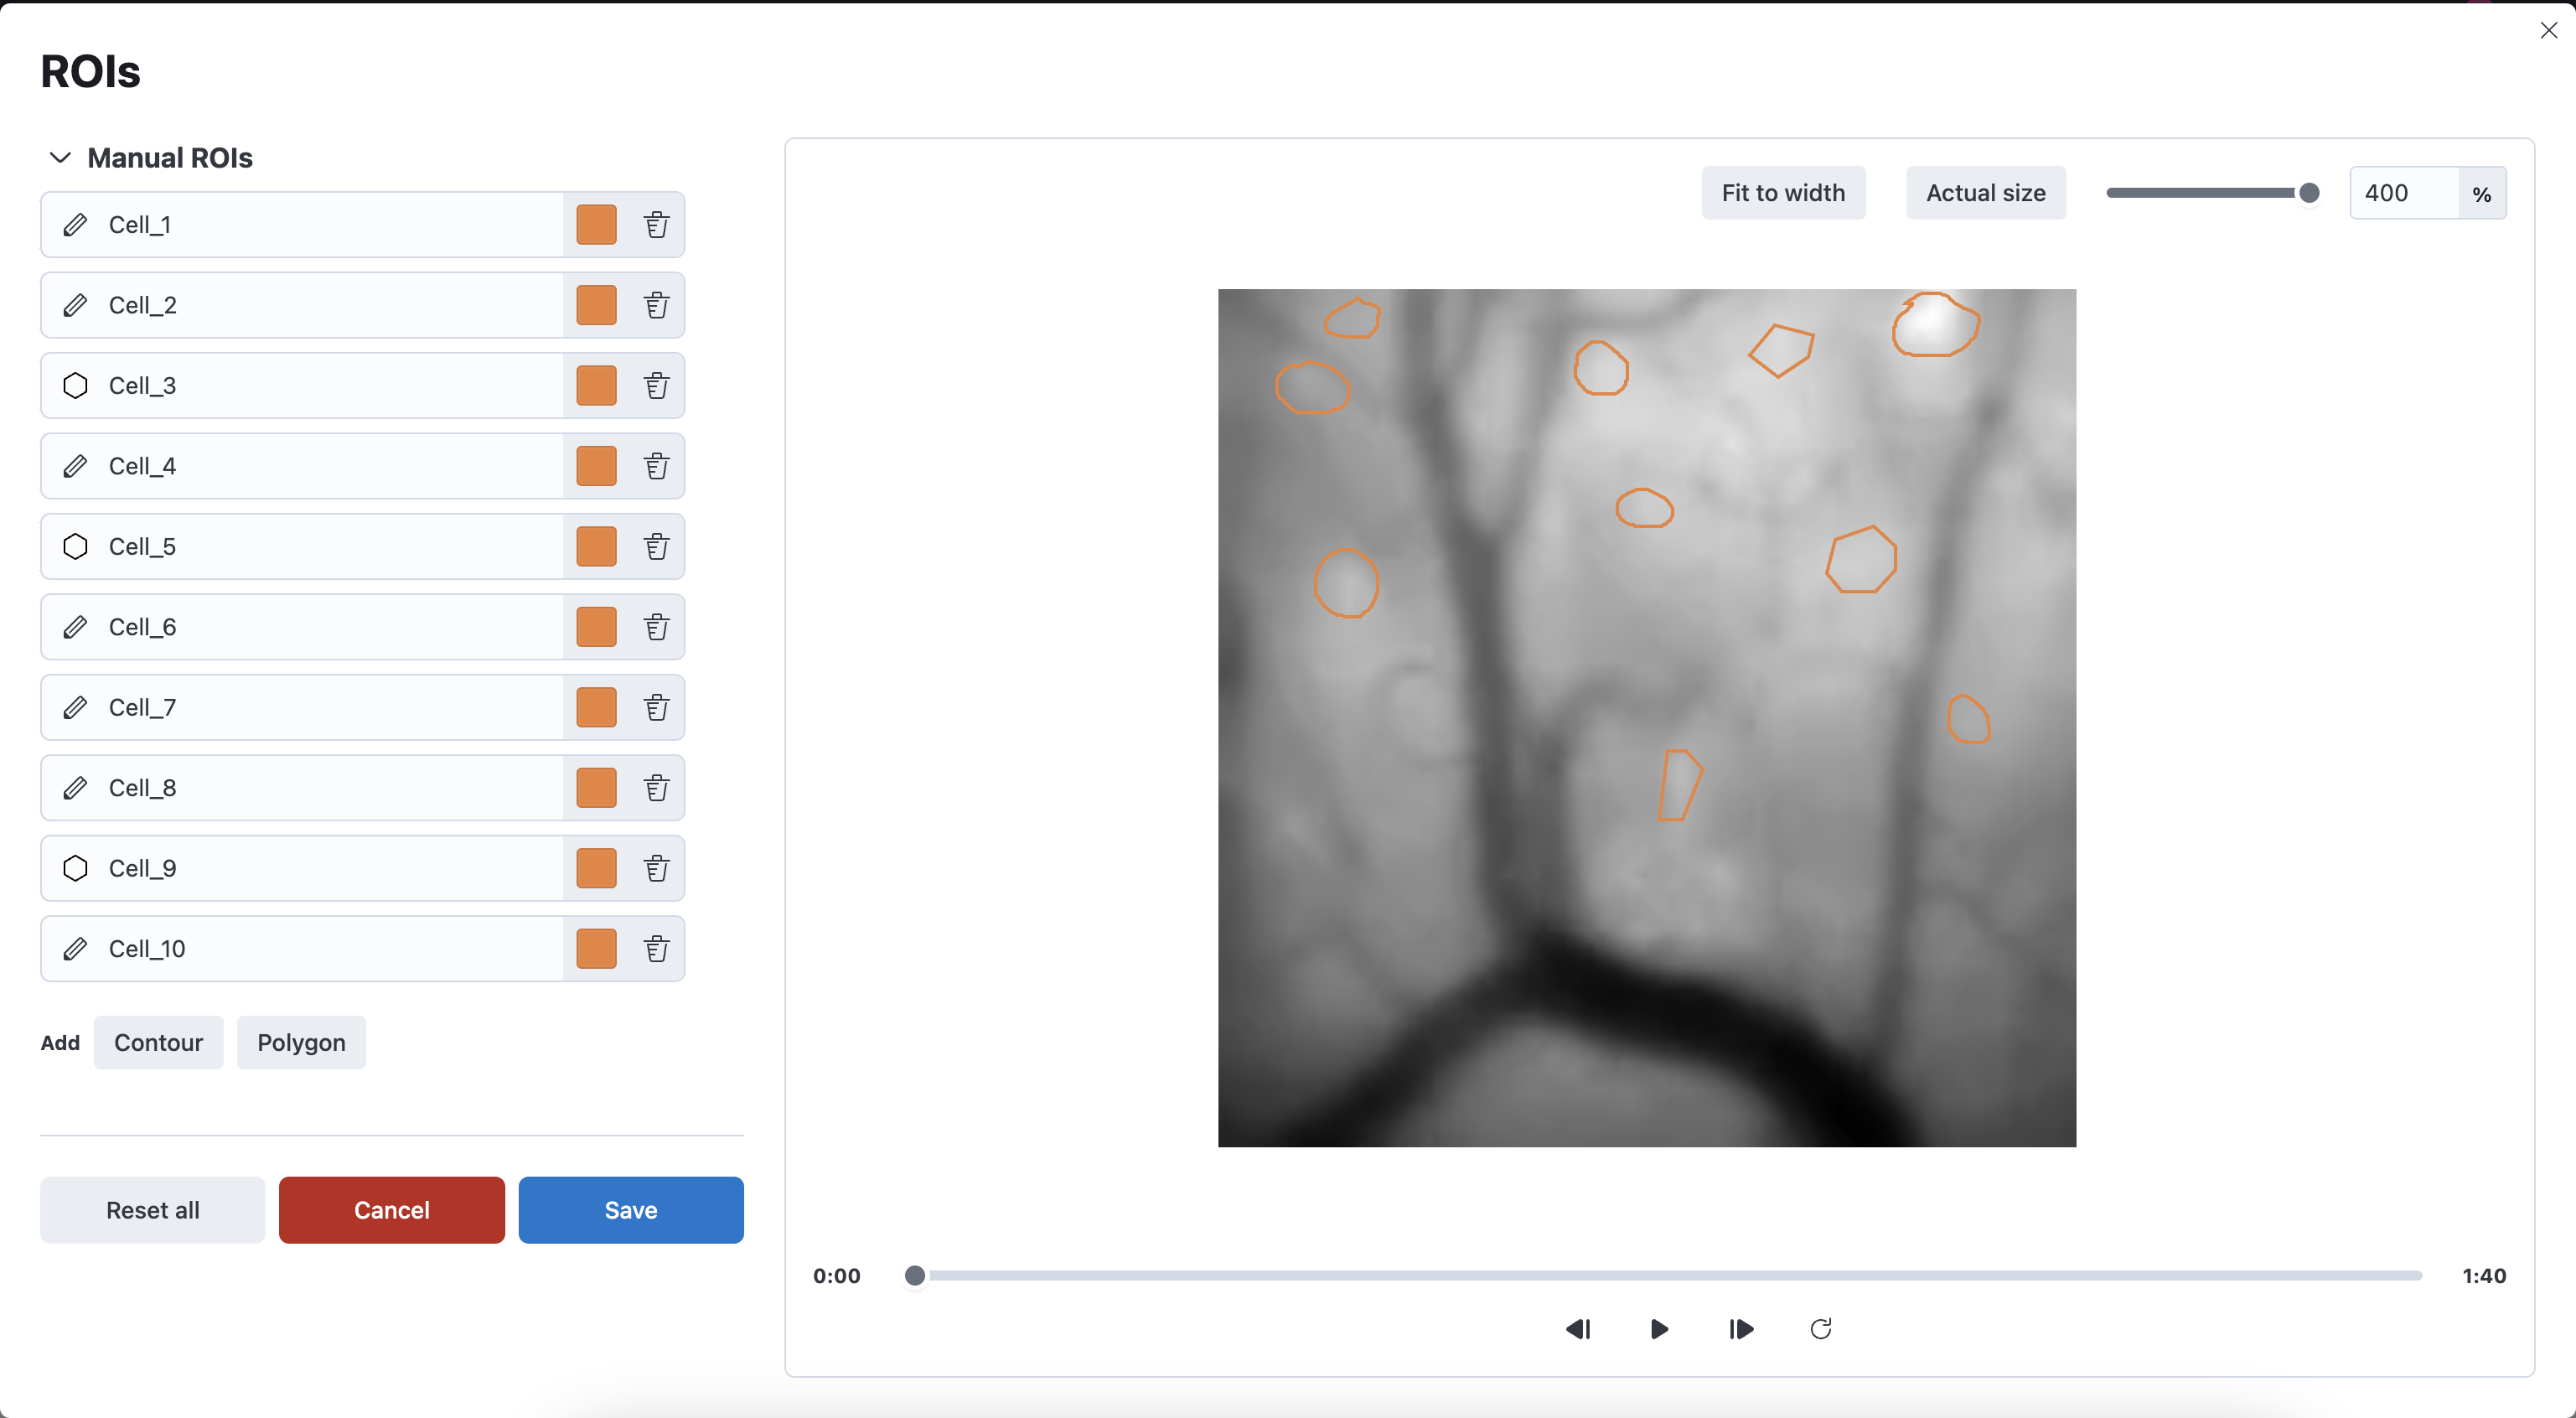
ROIs can be manually defined by using the interactive ROI editor.

Two types of shapes can be drawn:
- Polygon: Vertices can be added by clicking on the movie. An open contour can be closed by clicking again on the first vertex.
- Contour: Draw the ROI by clicking and holding the mouse’s left button down, moving the cursor and releasing the mouse’s left button.
Description
This operation allows you to manually define ROIs by drawing on a microscope movie, and extracting a cell set with the activity in the input ROIs.
Algorithm
This tool applies the ROIs to a movie to get mean activity traces. Each trace represents the mean activity in the movie associated with its corresponding ROI. More technically,
where \(M(x, y, t)\) is the value of the movie at position index \((x, y)\) and at time index, \(I(x, y)\) is the value of the ROI at position index \((x, y)\) and at time index, and \(A(t)\) is value of the trace at time index \(t\).
Outputs
Cell Set
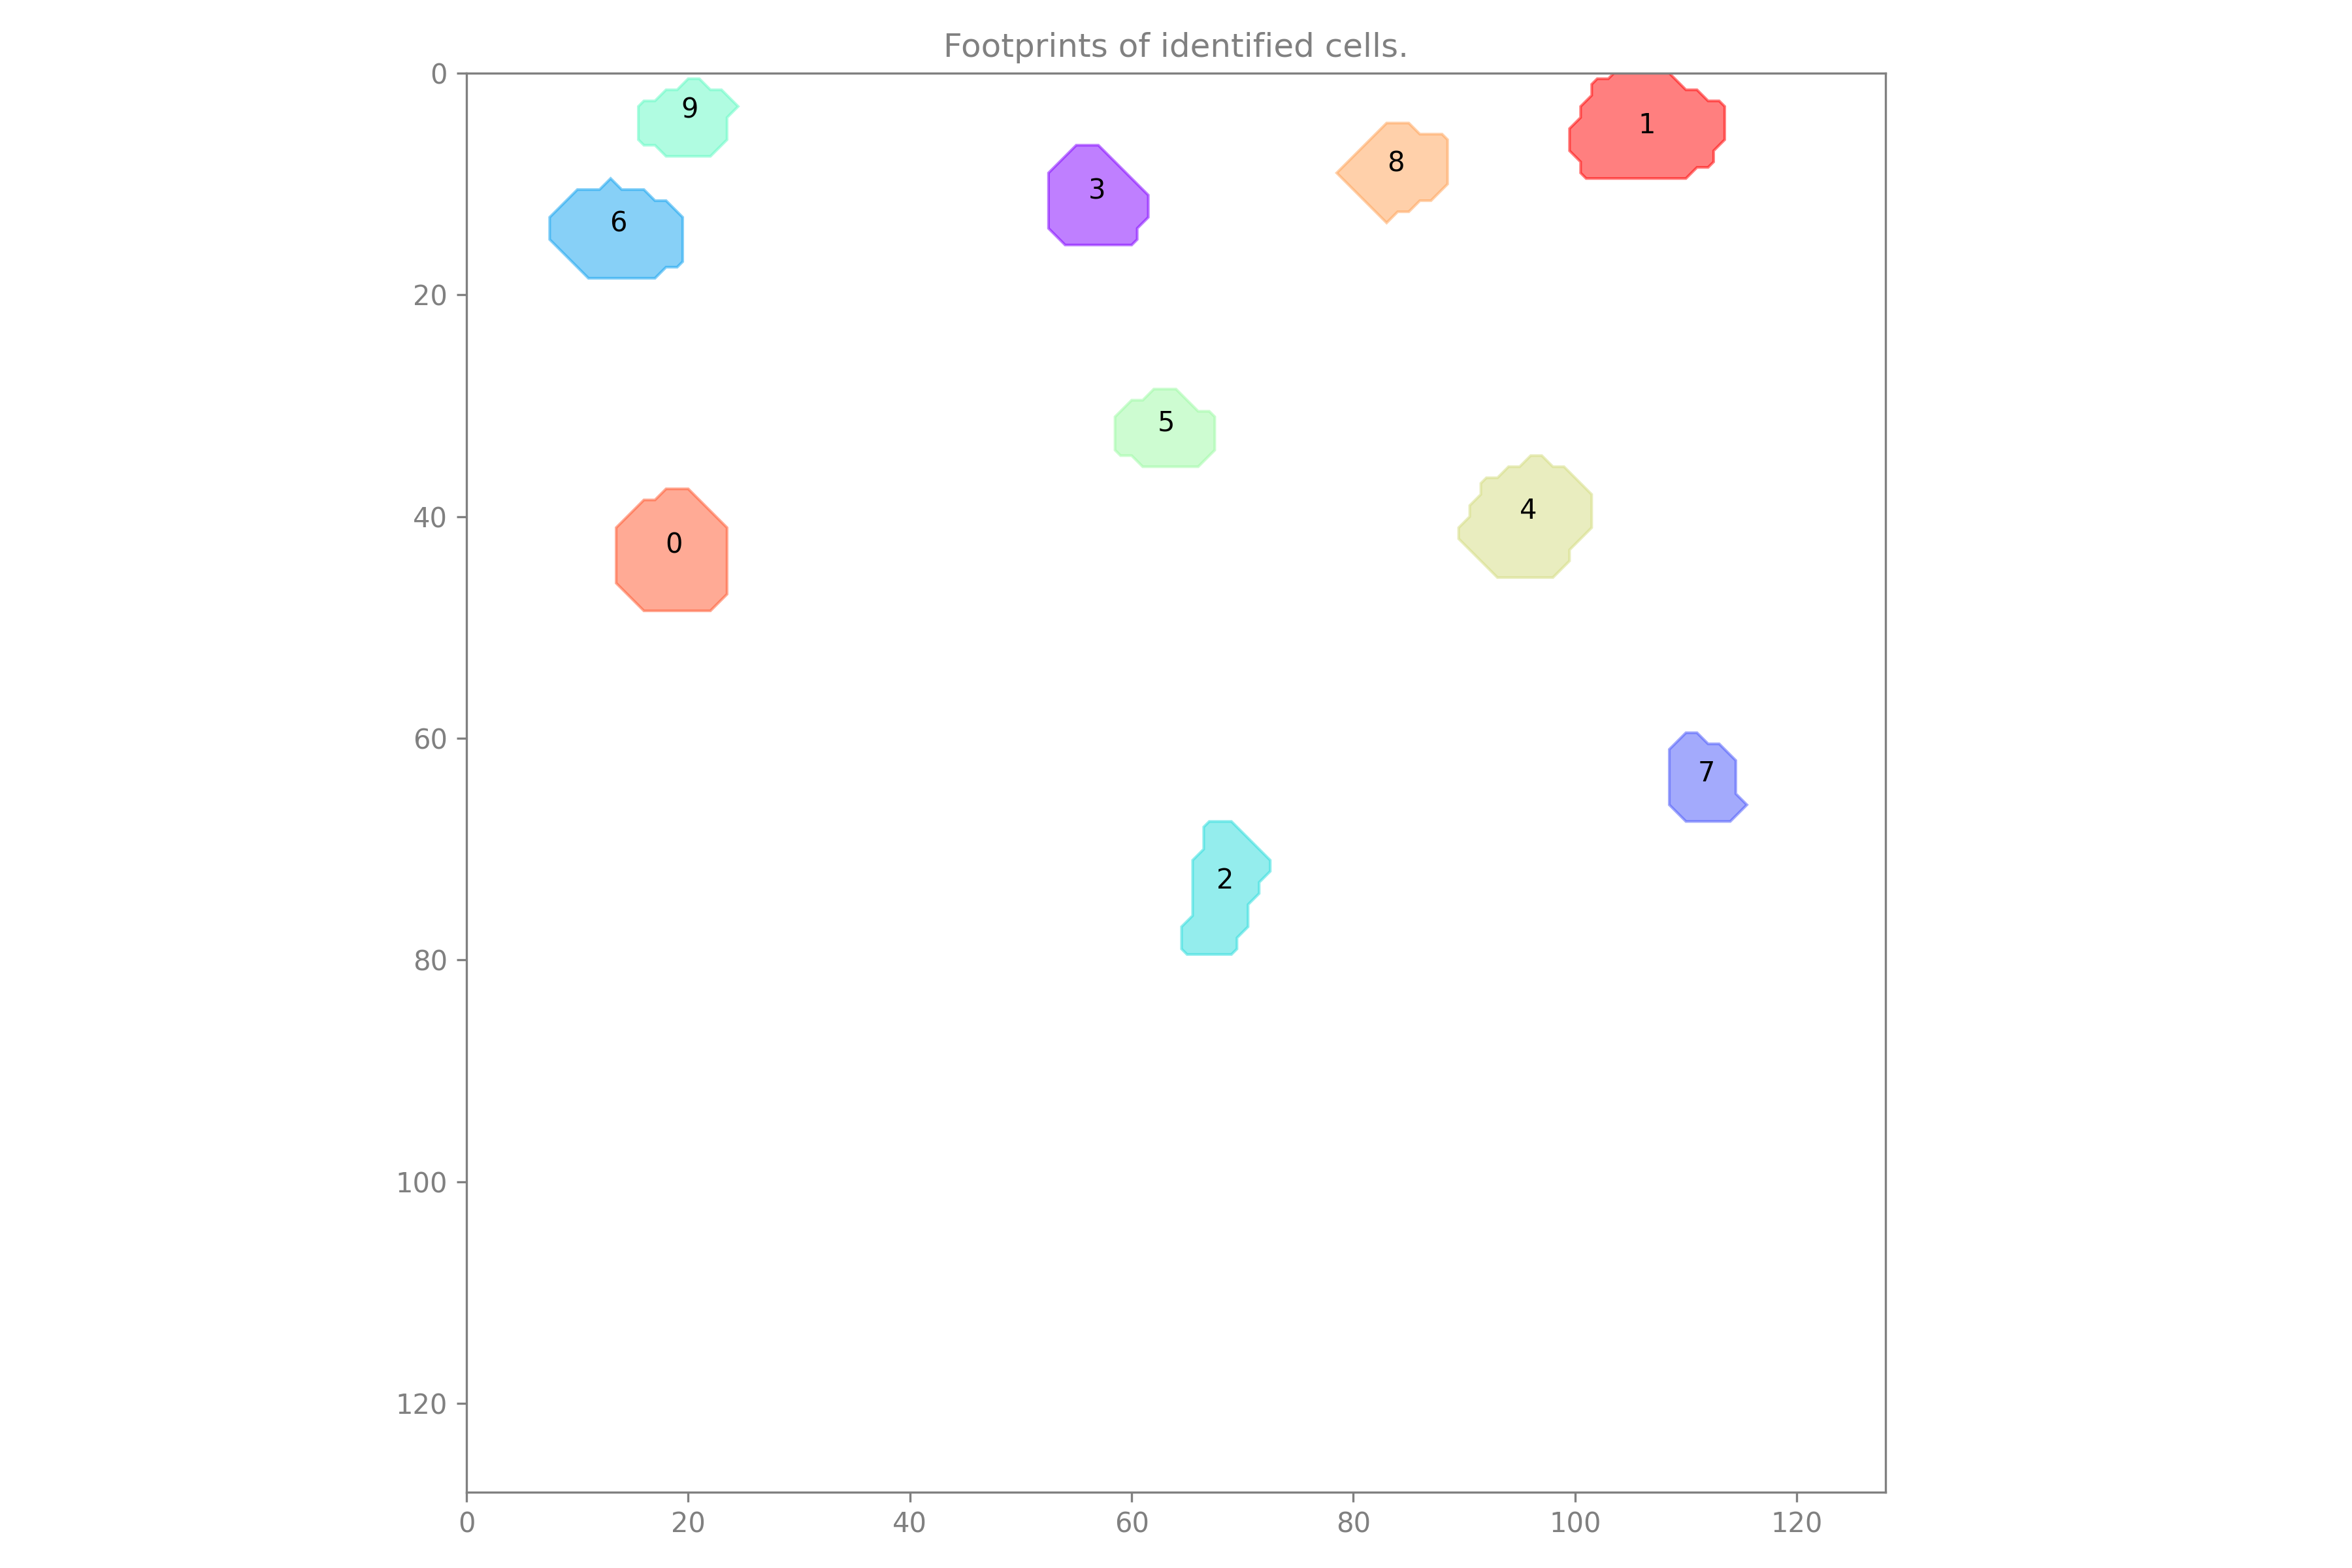
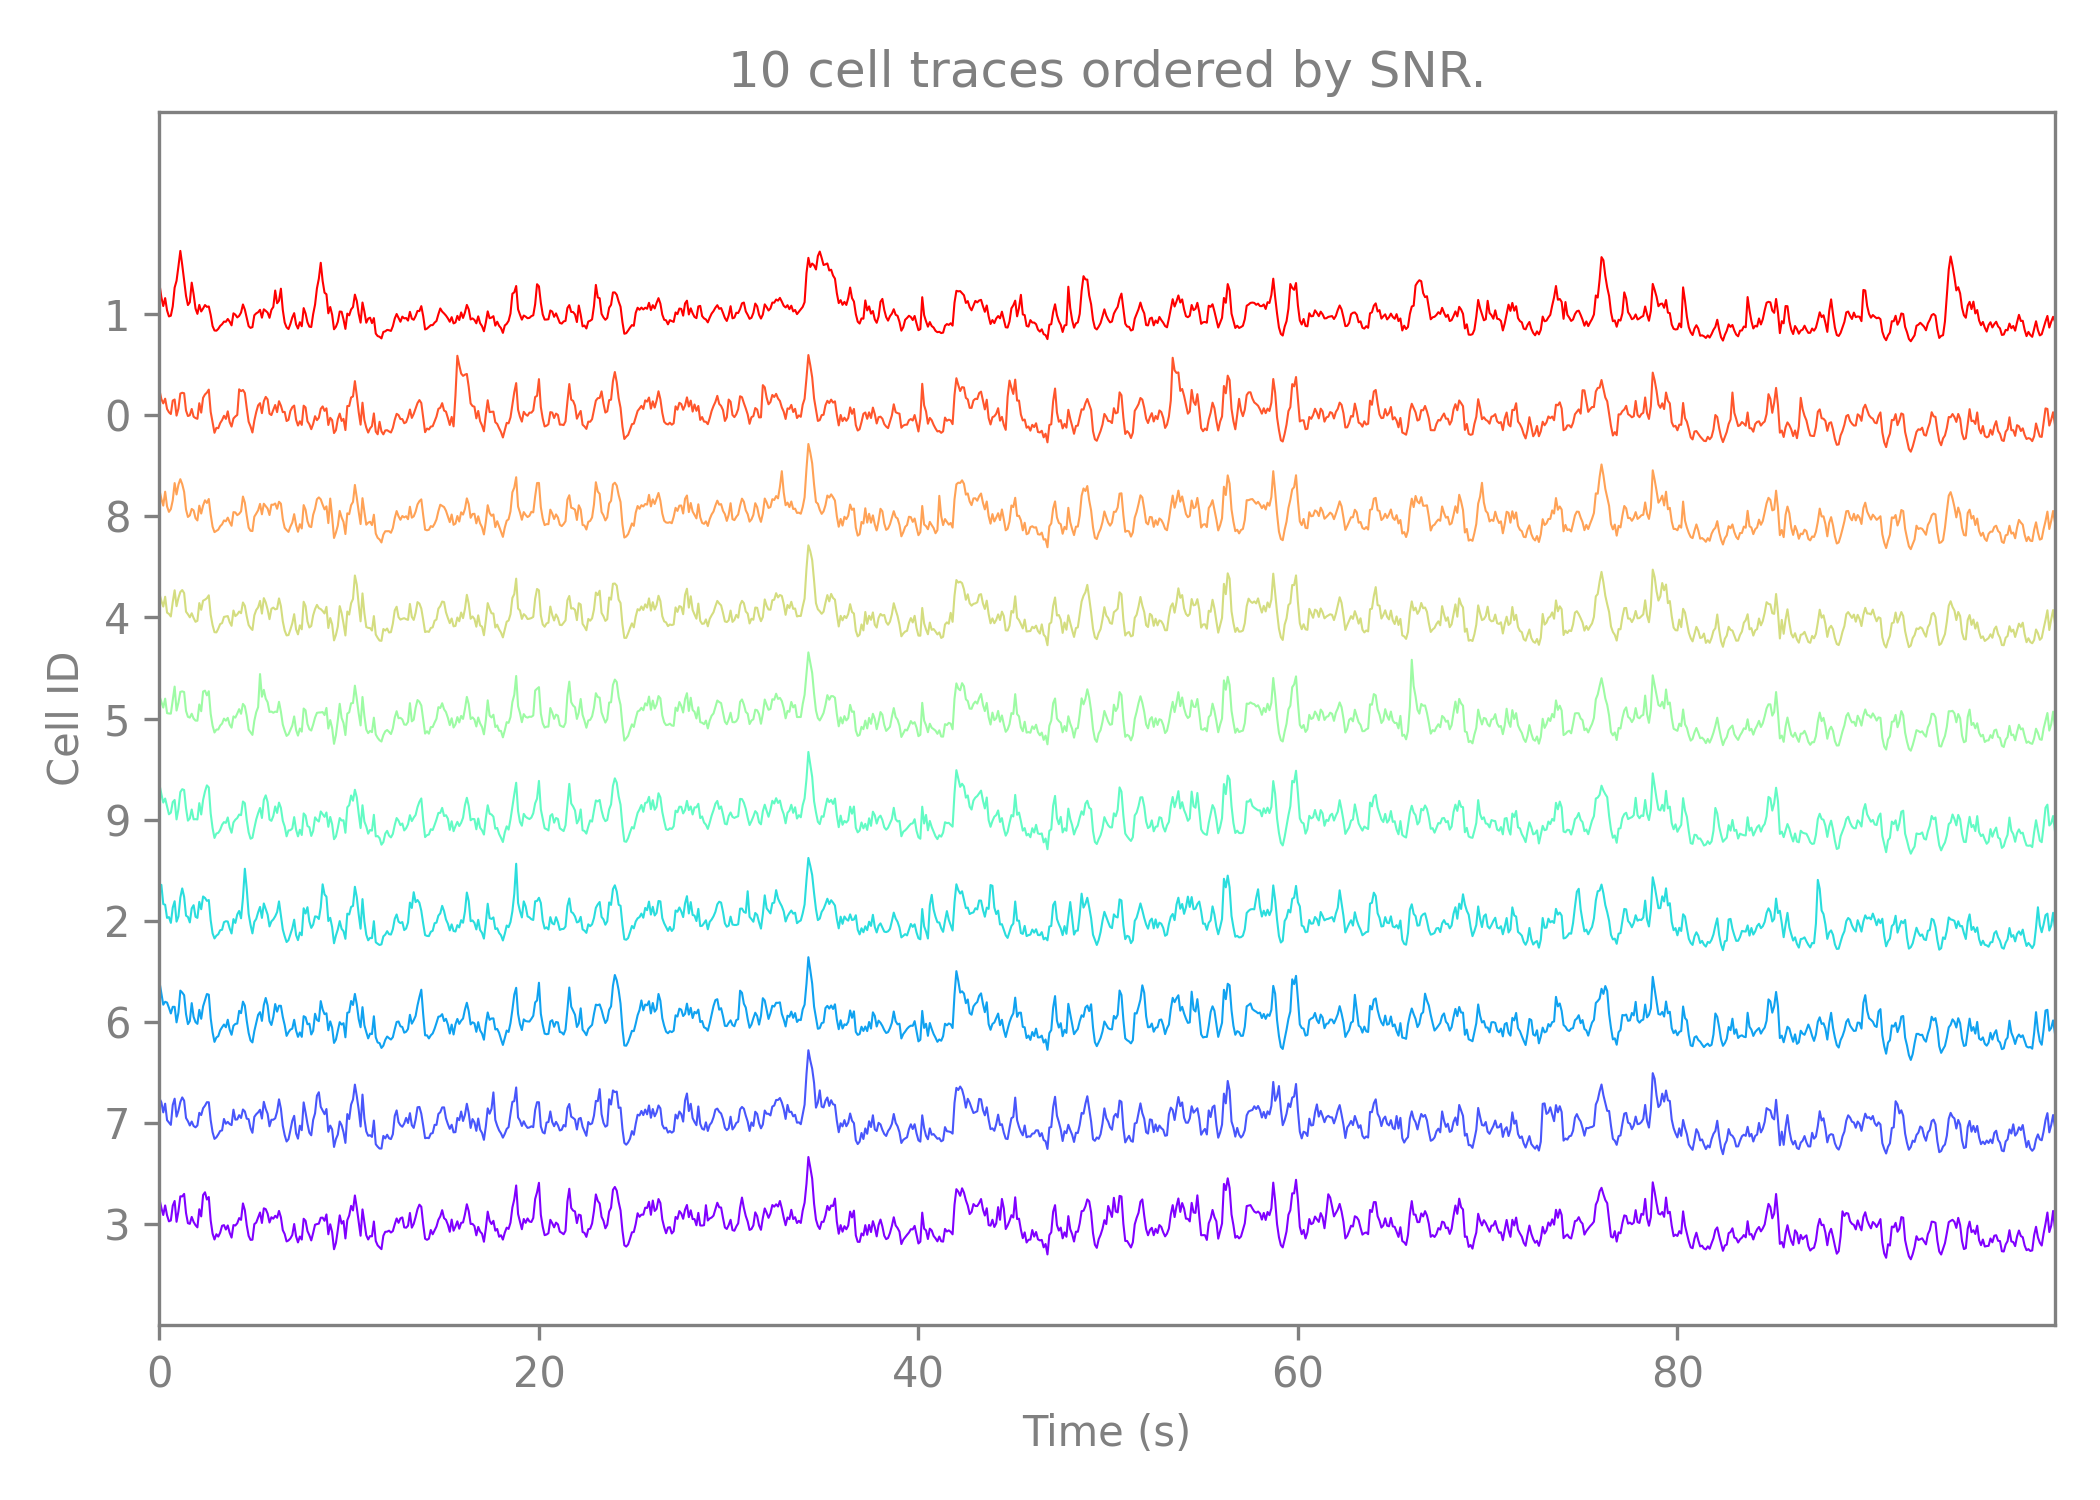
This tool outputs a cell set, where the footprints represent the ROIs sampled to the pixel grid of the movie and the traces are extracted by the tool algorithm. This cell set can be used in downstream tools to map cell activity with behavioral events, extract calcium events, or register with cell sets from other recordings, etc.
The cell set will include two previews. The first preview shows the rois for every cell in the cell set.

The second preview shows the traces extracted from the cell ROIs. The preview shows the 10 traces with the highest SNR in the cell set.
