Combine And Compare Locomotion Data
This tool uses 1.0 compute credits per hour.
Overview
This tool combines locomotion metrics from multiple recordings and statistically compares them across two groups. Specifically, this tool tests whether the distributions of speeds and the proportions of time spent moving & at rest are statistically different between the 2 groups of input data.
To perform the statistical test, the user can choose:
- whether or not the inputs are paired across the two groups
- what specific hypothesis to test (one-tailed or two-tailed)
- at what level to compare the data (by recording, by frame, or using hierarchical bootstrapping)
Parameters
| Parameter | Required? | Default | Description |
|---|---|---|---|
| Group 1 Locomotion Files | True | N/A | Locomotion metrics files belonging to the first group |
| Group 2 Locomotion Files | True | N/A | Locomotion metrics files belonging to the second group |
| Group 1 Name | True | N/A | Name of the first group being compared |
| Group 2 Name | True | N/A | Name of the second group being compared |
| Group 1 Color | False | Blue | Display color for the first group |
| Group 2 Color | False | Orange | Display color for the second group |
| Sample Method | False | hierarchical bootstrap | Determine what method to compare the data at |
| Comparison Type | False | Two-Tailed (Unequal) | Alternative hypothesis for statistical analysis |
| Data Pairing | False | unpaired | Whether the data is paired or unpaired |
| Number Of Bootstrap Iterations | False | 1000 | How many times to sample during the bootstrap |
Input Files
The inputs to this tool are a list of locomotion metrics files that are generated from the locomotion_metrics tool.
Input File Requirements
-
Each group must contain at least two recordings, otherwise the tool will terminate.
-
All input files must be generated using the same speed units to be compared (e.g. smoothed cm/s, cm/s, smoothed px/s, px/s). The tool preferentially looks for smoothed cm/s, then cm/s, then smoothed px/s, then px/s. If the input files have different speed units, the tool will terminate.
-
The input files must have more than one state in a recording to be compared. If the input files have only one state, the tool will terminate.
| Source Parameter | File Type | File Format |
|---|---|---|
| Group 1 Locomotion Files | experiment_annotations, experiment_annotations | csv, parquet |
| Group 2 Locomotion Files | experiment_annotations, experiment_annotations | parquet, csv |
Algorithm Description
The tool is summarized using a flowchart below.
The tool begins by combining the data from each group. Then the two groups are compared to determine if there is statistically significant difference between the speeds estimates and the move and rest states.
Combination
The combination step is performed independently for each input group. The combination step concatenates the data from each recording end to end, retaining all original columns, and adds a column to indicate the source file.
Comparison
Two comparisons are made using this tool. The first comparison is made between the two groups to determine if there is a difference in the distribution of speed estimates. The second comparison is made to determine if there is a difference in the proportion of the recordings spent in either move or rest states. There are three sampling methods that can be used to compare the data, which will result in different statistical tests being performed.
Hierarchical Bootstrapping Method
If the hierarchical bootstrapping method is selected, the data will be hierarchically resampled to generate a distribution of mean estimates1.
Hierarchical resampling involves resampling data with replacement at the level of the individual recordings, then resampling the frames of the recordings with replacement. For example, if there are 2 recordings in group 1 (A,B) and 3 recordings in group 2 (X,Y,Z), the hierarchical resampling method will resample 2 recordings from group 1 (e.g. AA, AB, BB, etc) and 3 recordings from group 2 (XXY, XYZ, YZZ, etc). The speed estimates of each the resampled recordings are then resampled with replacement, such that if recording A has 1000 frames, the hierarchical resampling method will resample 1000 frames. From this synthetic dataset, a single average metric is calculated for each group.
This process is repeated as many times as specified by the N Bootstraps parameter (by default 1000 times). The p-value is then calculated as the proportion of averages from group 1 that are greater than the averages from group 2. As a result, the precision of the p-value is directly correlated to the size of the null distribution, defined by the number of random shuffles. For example, if the null distribution is created by 1000 random shuffles, the resolution of the p-value will be 0.001. In this example the smallest p-value greater than 0 that can be obtained is 0.001. If there are no values in the group 1 that are greater than group 2, the p-value will be 0.
Figure
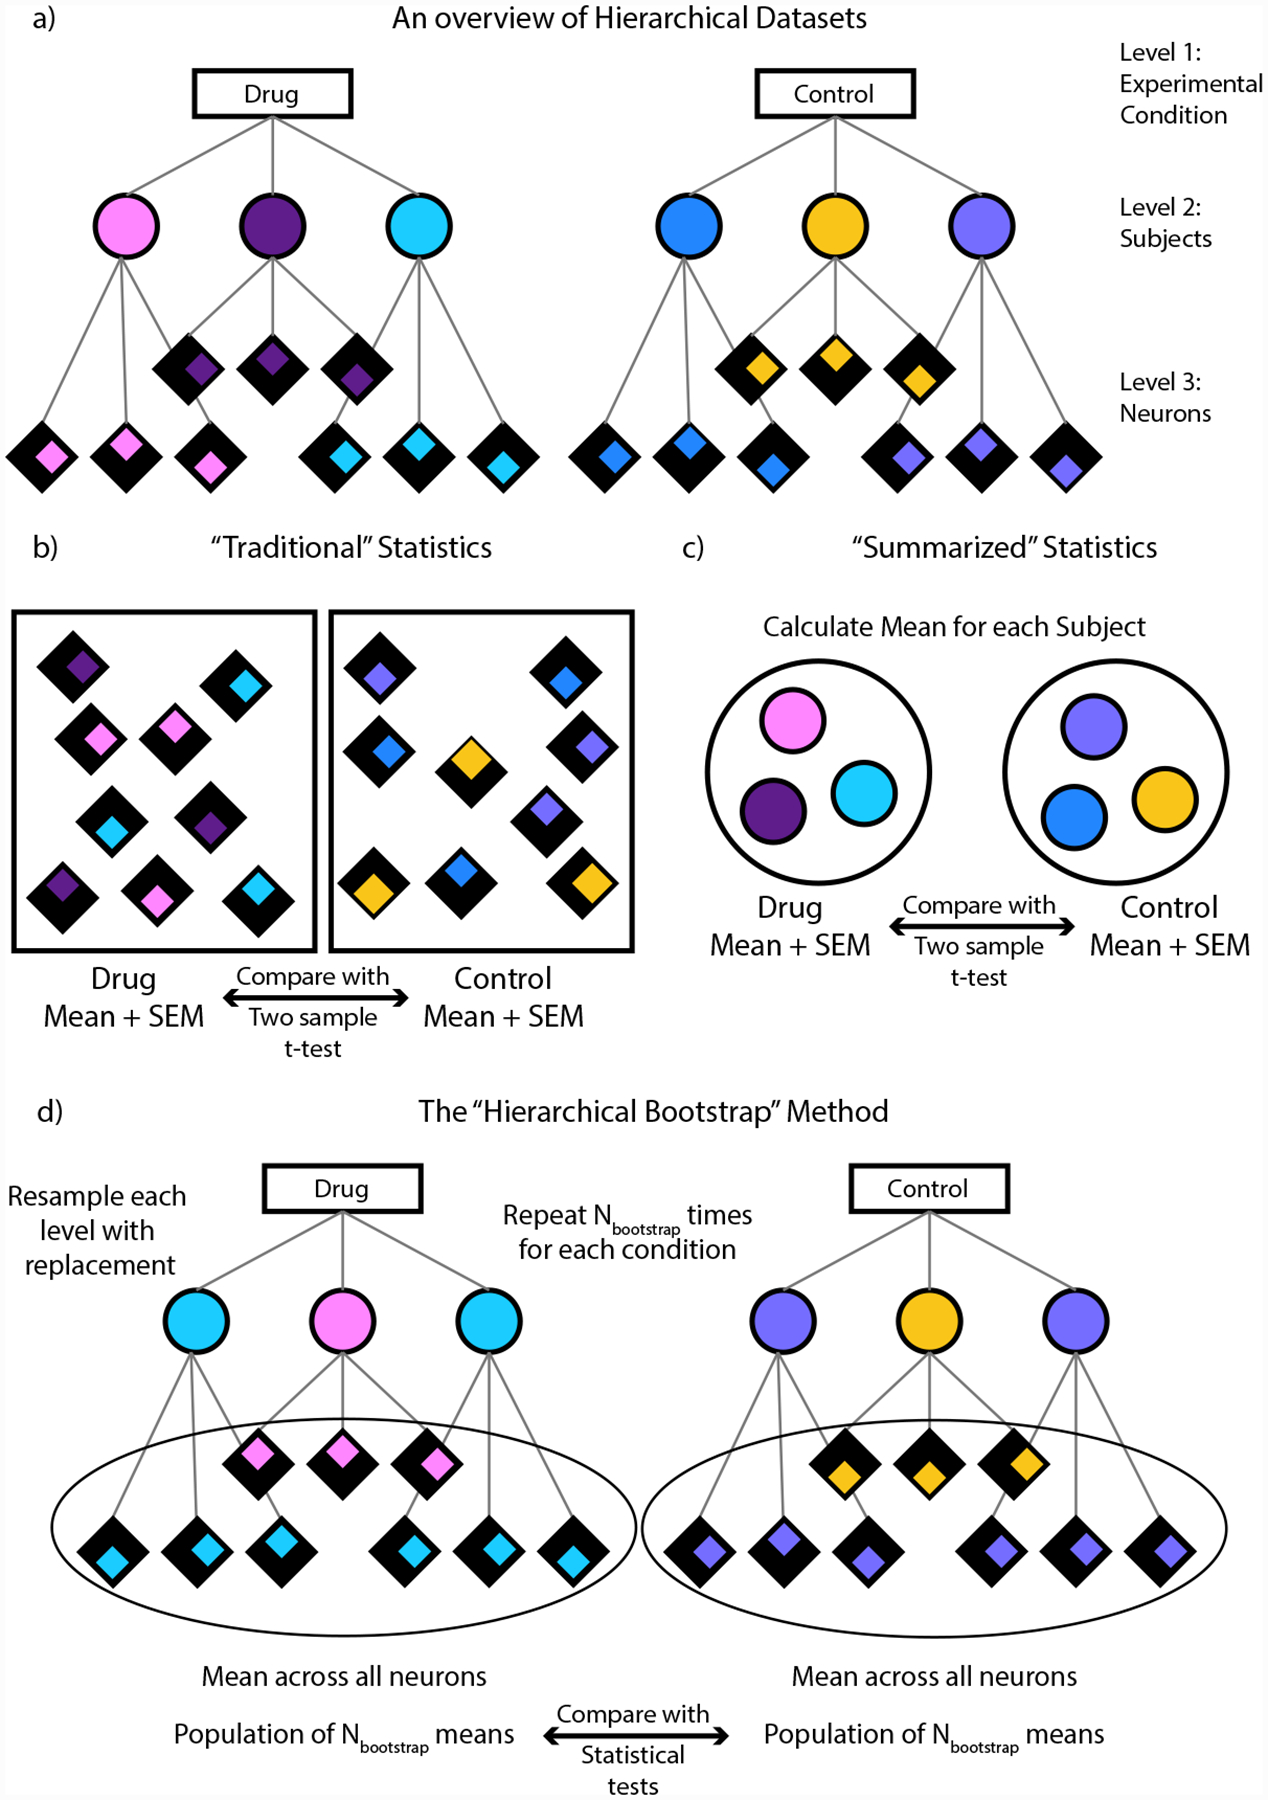
a) An example of a hierarchical dataset. Here the dataset is divided into 3 levels, with the first level containing the experimental groups to be compared, the second containing the individual subjects and the third containing the individual neurons per subject. Each subject is color coded and the neurons per subject are distinguished by the position of the colored diamond. b) In “Traditional” statistics, the means for each group is computed across all the neurons and are then compared using a two sample t-test. c) In “Summarized” statistics, the mean for each subject is computed first. These means are then used to compute an overall mean for each group and the groups are compared using a two-sample t-test. d) In the “Hierarchical Bootstrap” method, we create new datasets Nbootstrap times by resampling with replacement first at the level of subjects followed by neurons within a subject. We then compute the mean across all neurons every time we perform resampling. The final statistic is computed on this population of resampled means.1c is computed on this population of resampled means.1
Move vs Rest State Comparison
If a one sided alternative hypothesis is selected, the move vs rest state comparison will perform opposite tests for the move and rest proportions. For example, if the alternative hypothesis is selected as greater, the following hypothesis will be tested:
group 1 move proportion < group 2 move proportion
group 1 rest proportion > group 2 rest proportion
because we expect the move and rest proportions to be inversely related.
By Recording
You can also compare data on a recording by recording basis. This method will average the speed estimates and the proportion of time spent in move and rest states for each recording. The following statistical test will then be performed on the averages of the recordings.
First the normality of the data is first tested based on D'Agostino and Pearson's23. If the data is normally distributed, and the data is paired, a related t-test is performed. If the data is normally distributed and the data is unpaired, an independant t-test is performed. If the data is not normally distributed, and the data is paired, a Wilcoxon signed-rank test is performed. If the data is not normally distributed and the data is unpaired, a Mann-Whitney U test is performed.
| Normality | Pairing | Test |
|---|---|---|
| Normal | Paired | Related t-test |
| Normal | Unpaired | Independent t-test |
| Non-normal | Paired | Wilcoxon signed-rank test |
| Non-normal | Unpaired | Mann-Whitney U test |
Move vs Rest State Comparison
If a one sided alternative hypothesis is selected, the move vs rest state comparison will perform opposite tests for the move and rest proportions. For example, if the alternative hypothesis is selected as greater, the following hypothesis will be tested:
group 1 move proportion < group 2 move proportion
group 1 rest proportion > group 2 rest proportion
because we expect the move and rest proportions to be inversely related.
By Frame
You can also compare data on a frame by frame basis. This method will compare the total distribution of speed estimates per frame, discarding recording information. The same statistical tests as the recording by recording method will be performed on the speed estimates.
Move vs Rest State Comparison
For the move vs rest state comparison, a Two Proportion Z-test is performed on the total number of frames moving compared to non-moving, and resting compared to non-resting, discarding recording information (undefined is included in non-moving and non-resting).
If a one sided alternative hypothesis is selected, the move vs rest state comparison will perform opposite tests for the move and rest proportions. For example, if the alternative hypothesis is selected as greater, the following hypothesis will be tested:
group 1 move proportion < group 2 move proportion
group 1 rest proportion > group 2 rest proportion
because we expect the move and rest proportions to be inversely related.
Outputs
Combination Outputs
Combination Locomotion Data
A csv file in IDEAS experiment annotations format containing the locomotion activity data of all recordings in the group. This will carry over all the columns that were included in the input files, as well as a column that indicates the file that the data came from.
Here are the possible columns that can be included in the output file:
| Required | Description |
|---|---|
| Global Frame Number | The frame number in the global video series |
| Movie Number | The number of the movie in the series |
| Local Frame Number | The frame number within a particular movie |
| Hardware counter (us) | Counter representing hardware timestamp in microseconds |
| Frame Timestamp (s) | Timestamp of the frame in seconds |
| Bounding Box Left | Left coordinate of the bounding box |
| Bounding Box Top | Top coordinate of the bounding box |
| Bounding Box Right | Right coordinate of the bounding box |
| Bounding Box Bottom | Bottom coordinate of the bounding box |
| Bounding Box Center X | X-coordinate of the center of the bounding box |
| Bounding Box Center Y | Y-coordinate of the center of the bounding box |
| Confidence | Confidence level of the detected subject |
| Displacement (px) | Frame-frame displacement of the object in pixels |
| Speed (px/s) | Speed of the object in pixels per second |
| File Name | Name of the file containing the frame |
| Situationally Present | Description |
|---|---|
| Smoothed Speed (px/s) | Filtered speed of the object in pixels per second |
| Displacement (cm) | Displacement of the object in centimeters |
| Speed (cm/s) | Speed of the object in centimeters per second |
| Smoothed Speed (cm/s) | Filtered speed of the object in centimeters per second |
| State | State of the subject (e.g., move, rest, undefined) |
The output figures will vary depending on the sampling method selected.
Combination Figures
The combination figures will show a preview of the data in each group. If sample method is set to by recording or hierarchical bootstrap, the combination preview will show data averaged by recording.
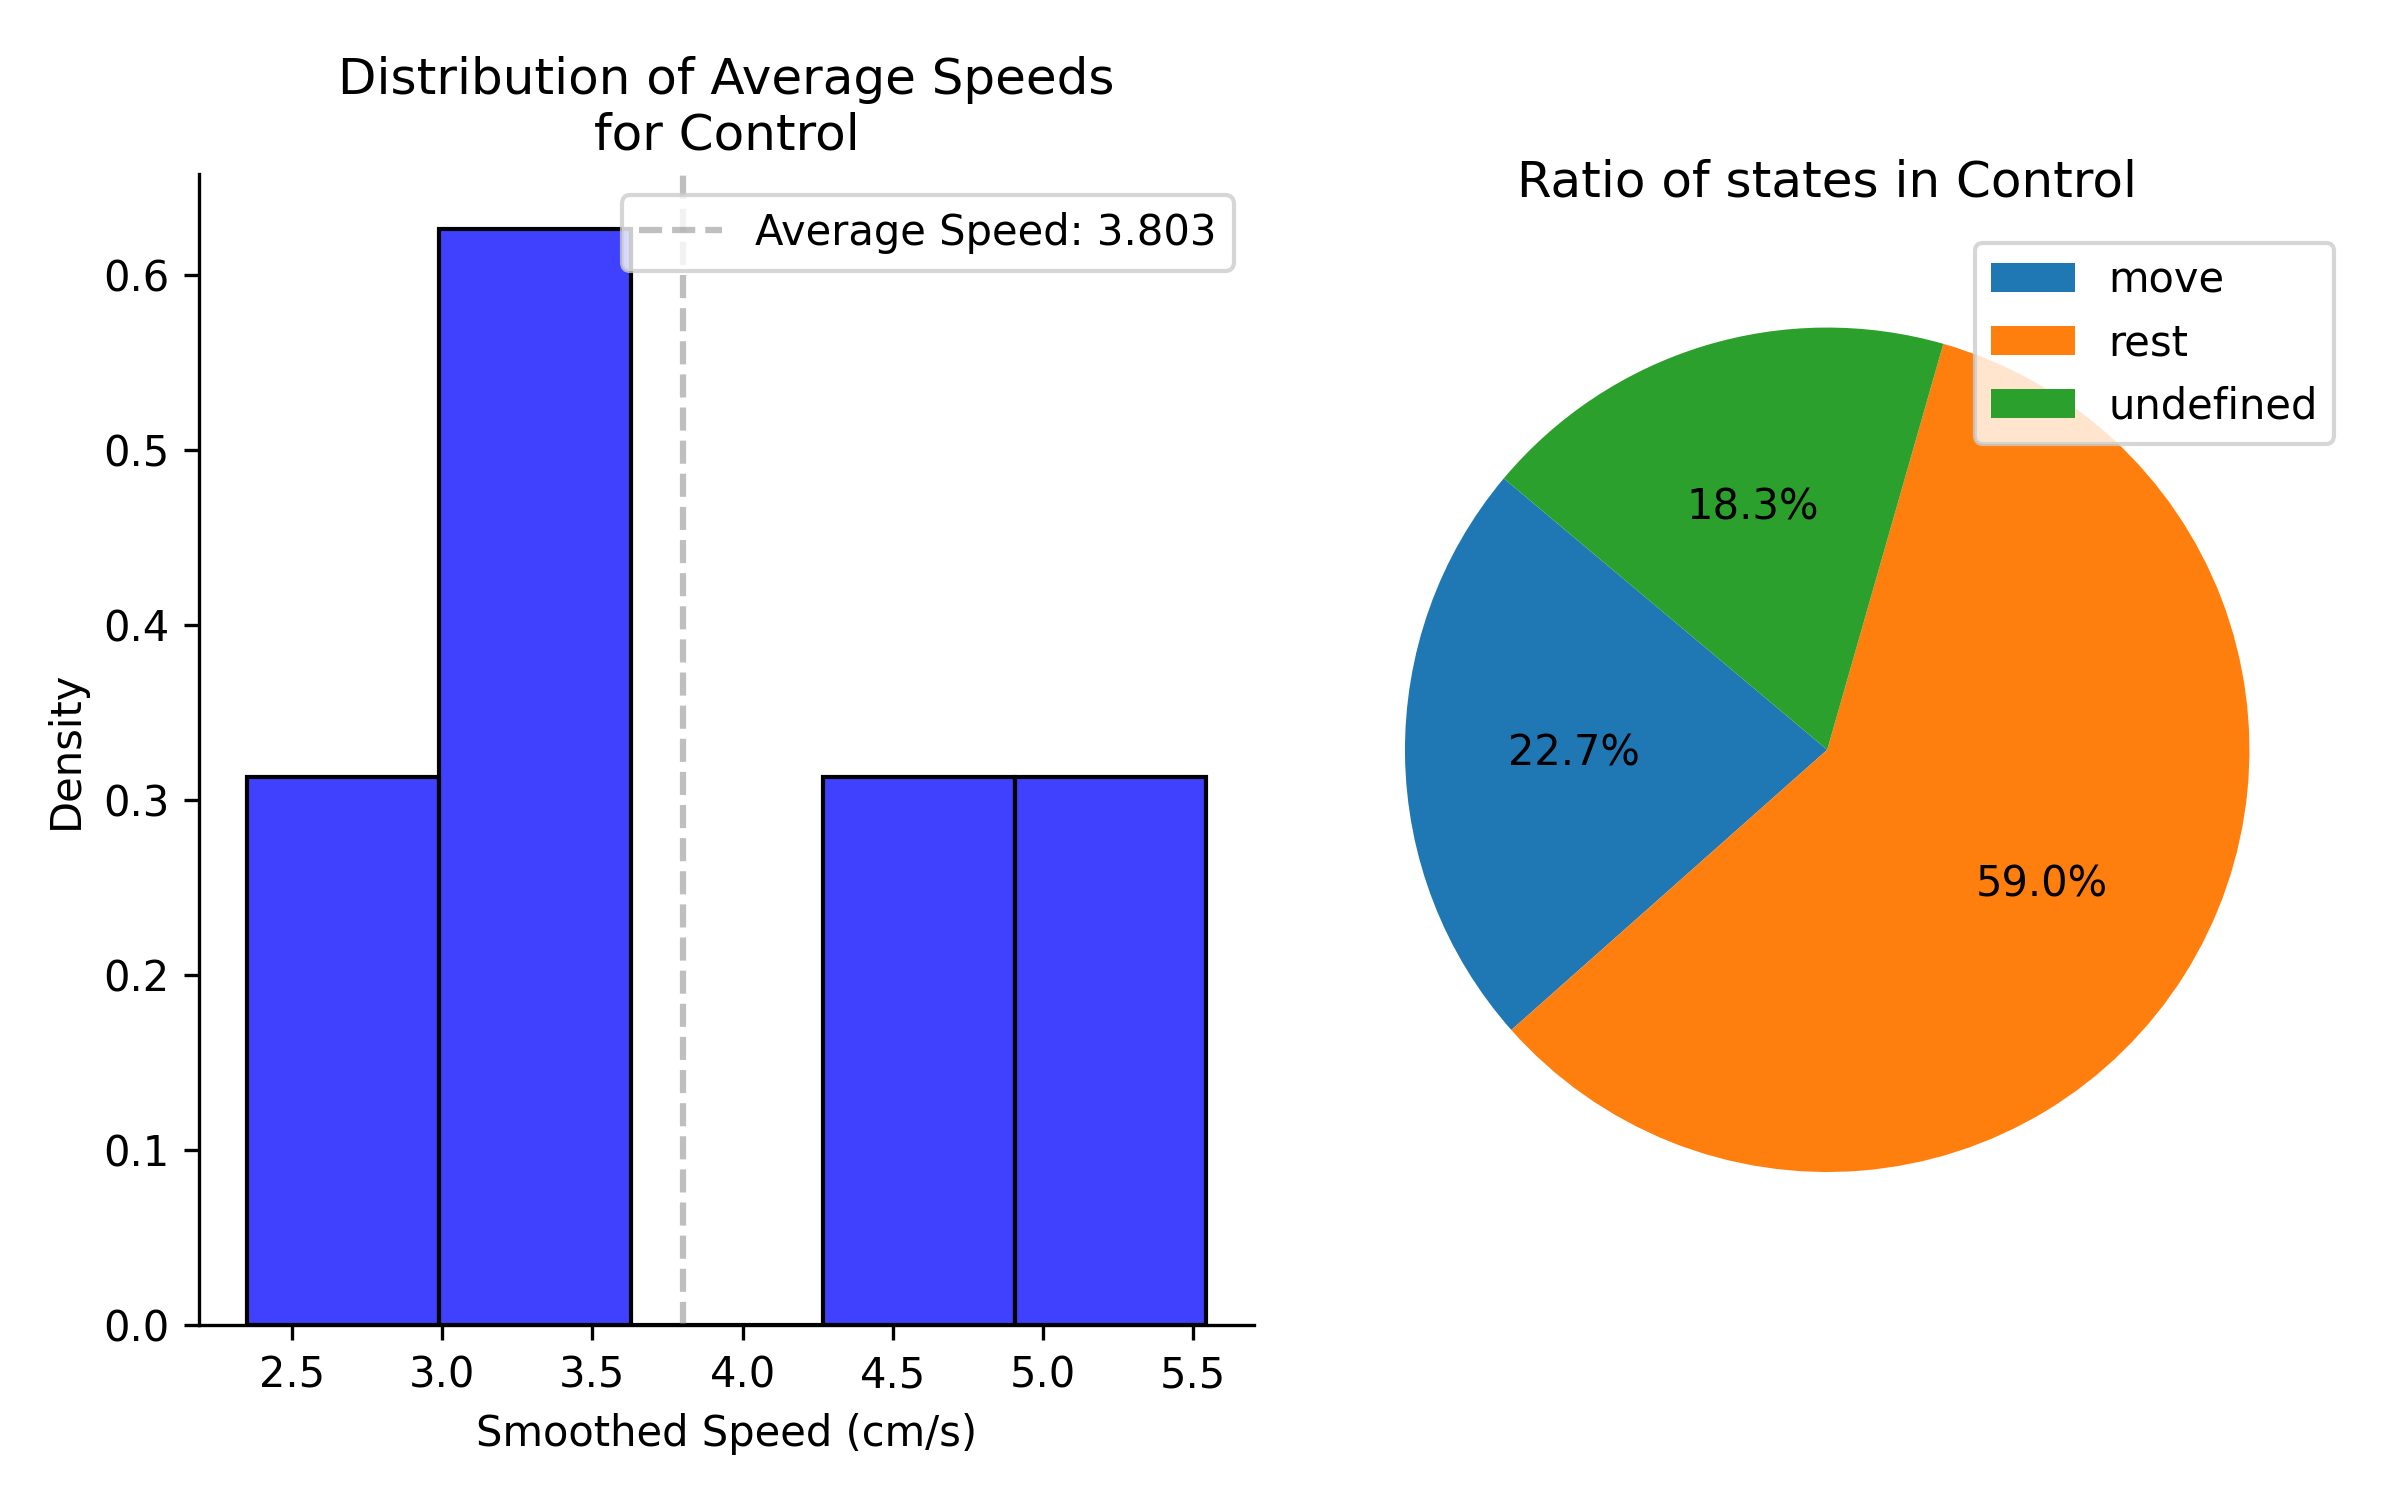
Left column shows distribution of average speed for all recordings in group 1. Right panel shows the average percentage of time spent in each state for all recordings in group 1.
If sample method is set to by frame, the data will be all frames.
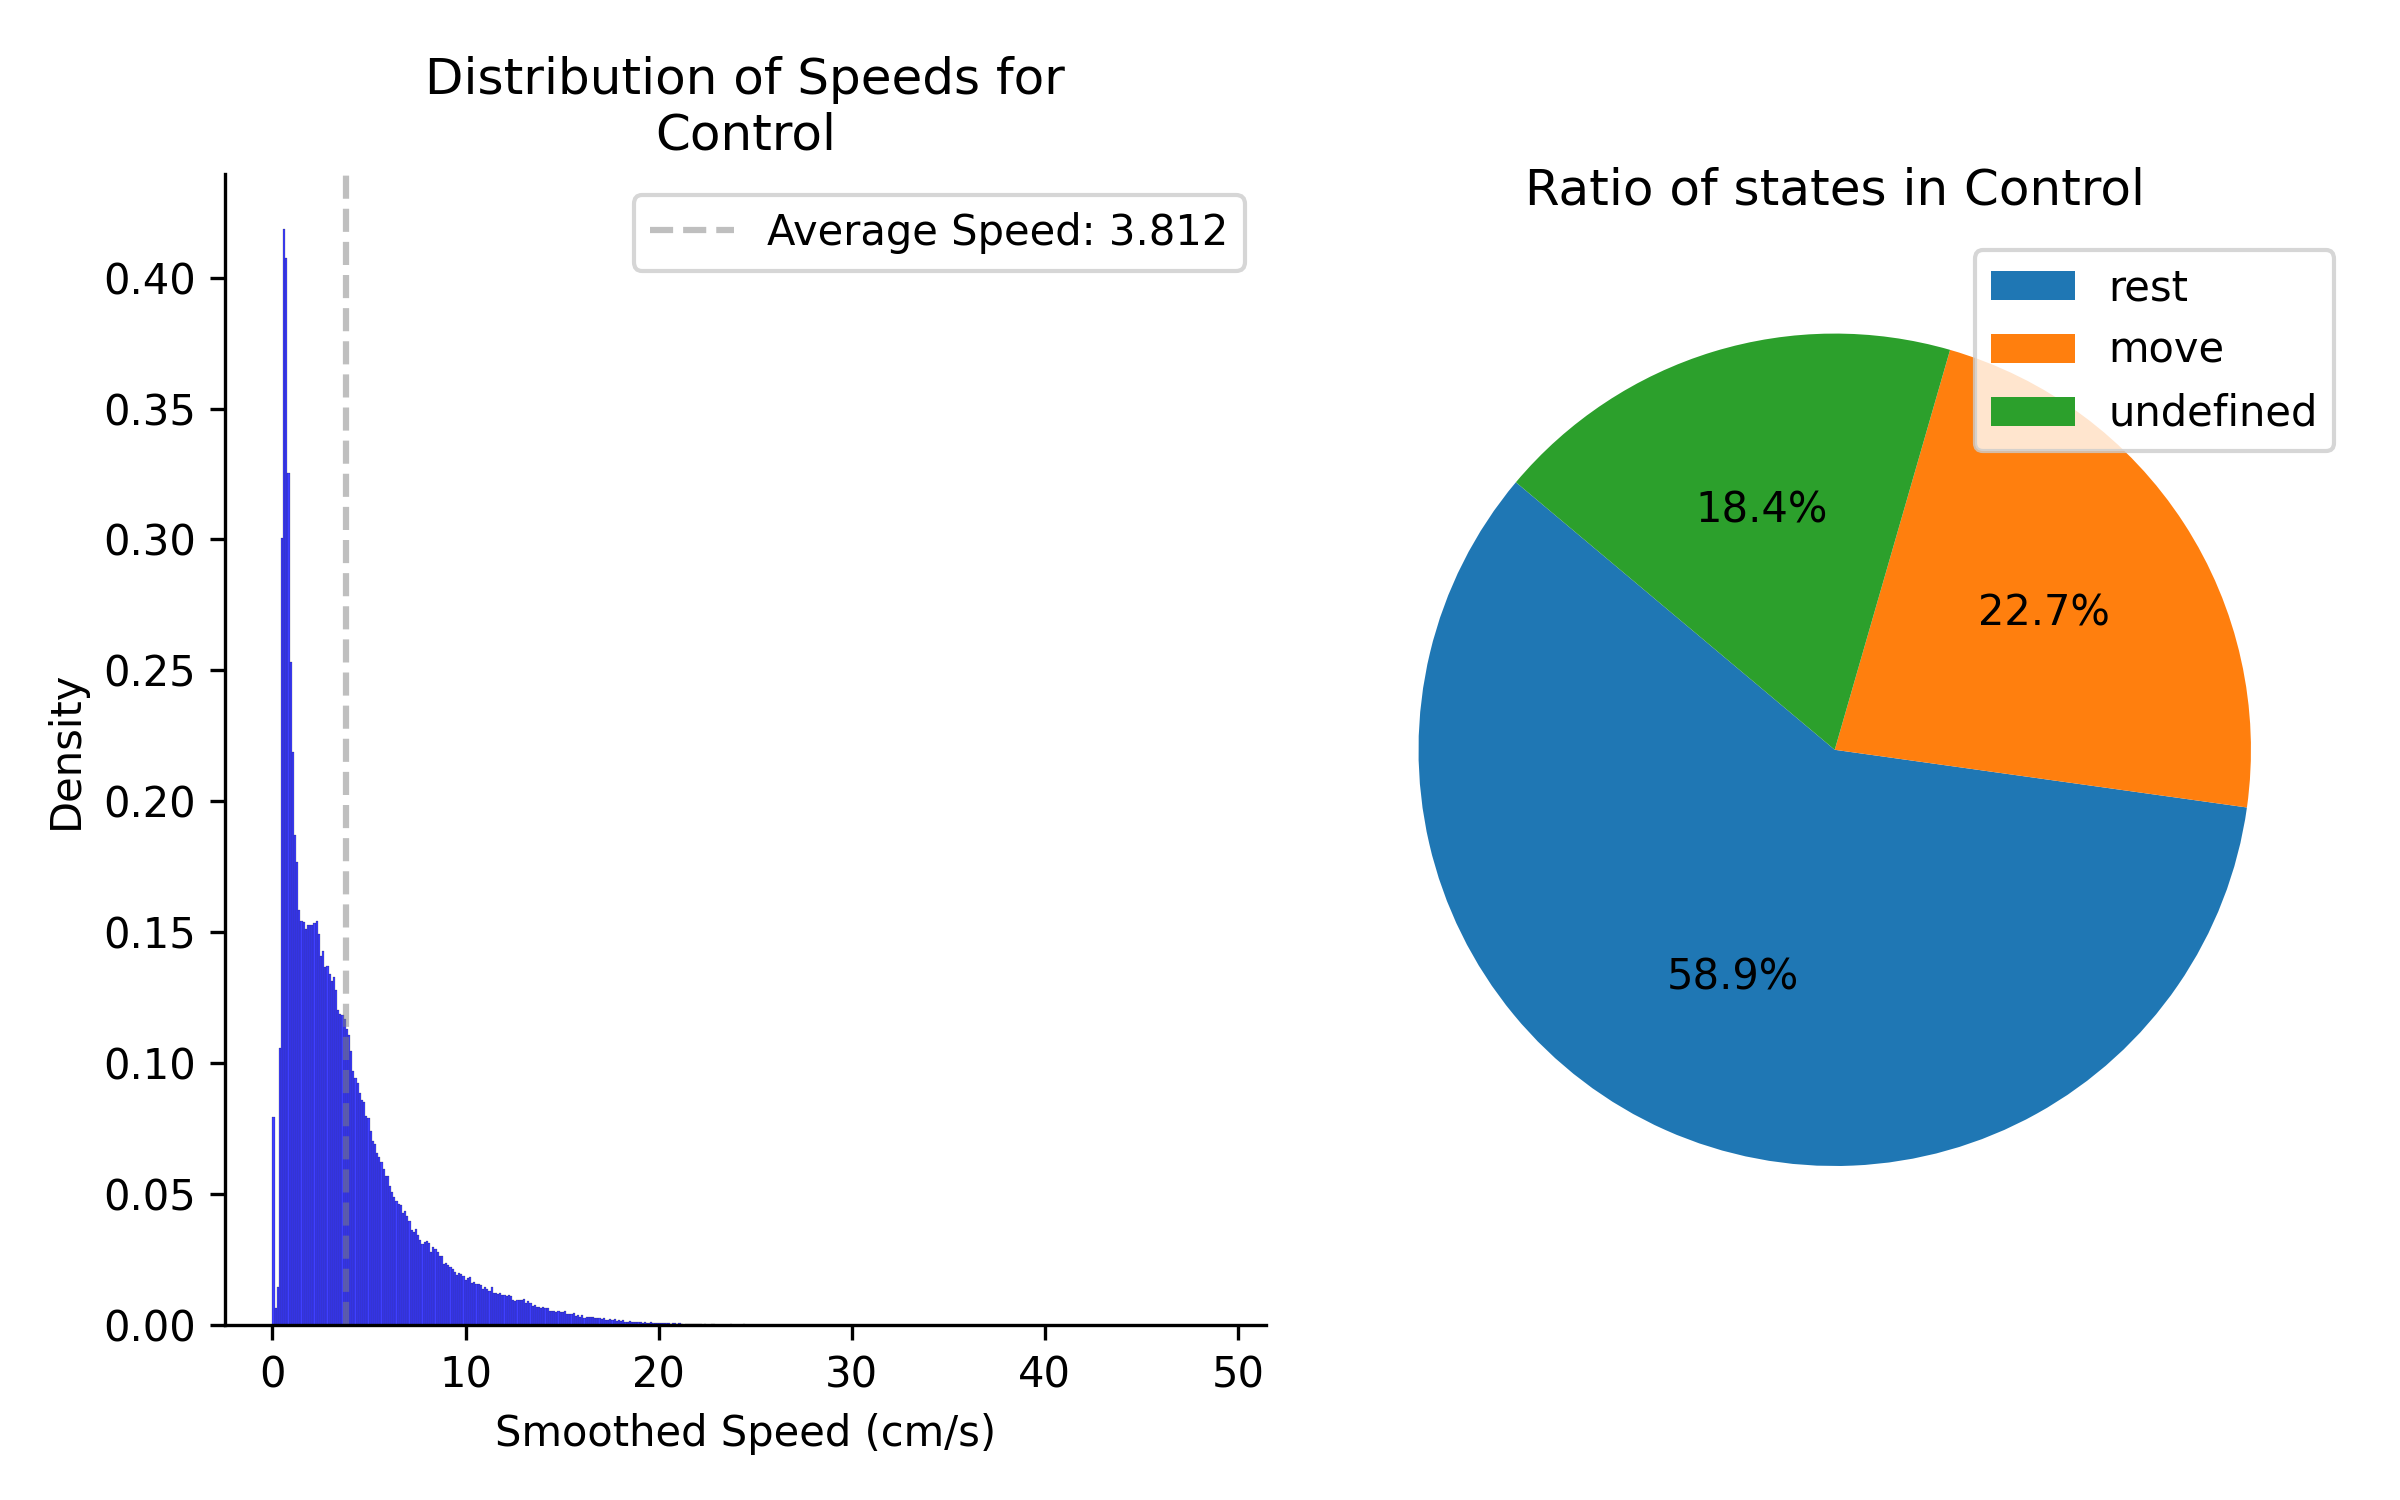
Left column shows distribution of speeds for all data in group 1. Right panel shows the percentage of time spent in each state for all data in group 1.
Comparison Ouputs
The comparison figures will also vary depending on whether the comparison is made using the hierarchical bootstrapping method or not.
Speed Comparison Outputs
Hierarchical Bootstrapping Method Data
The hierarchical bootstrapping method will output a csv file containing the distribution of average speed estimates for each group, where the number of values in the distribution is determined by the N Bootstraps parameter.
Example Output
| Group | Speed |
|---|---|
| Control | 7.8265 |
| Control | 4.2917 |
| Drug | 6.1593 |
| Drug | 8.7451 |
Hierarchical Bootstrapping Method Preview
The hierarchical bootstrapping method will show the distribution of average speed estimates for each group, where the number of values in the distribution is determined by the N Bootstraps parameter.
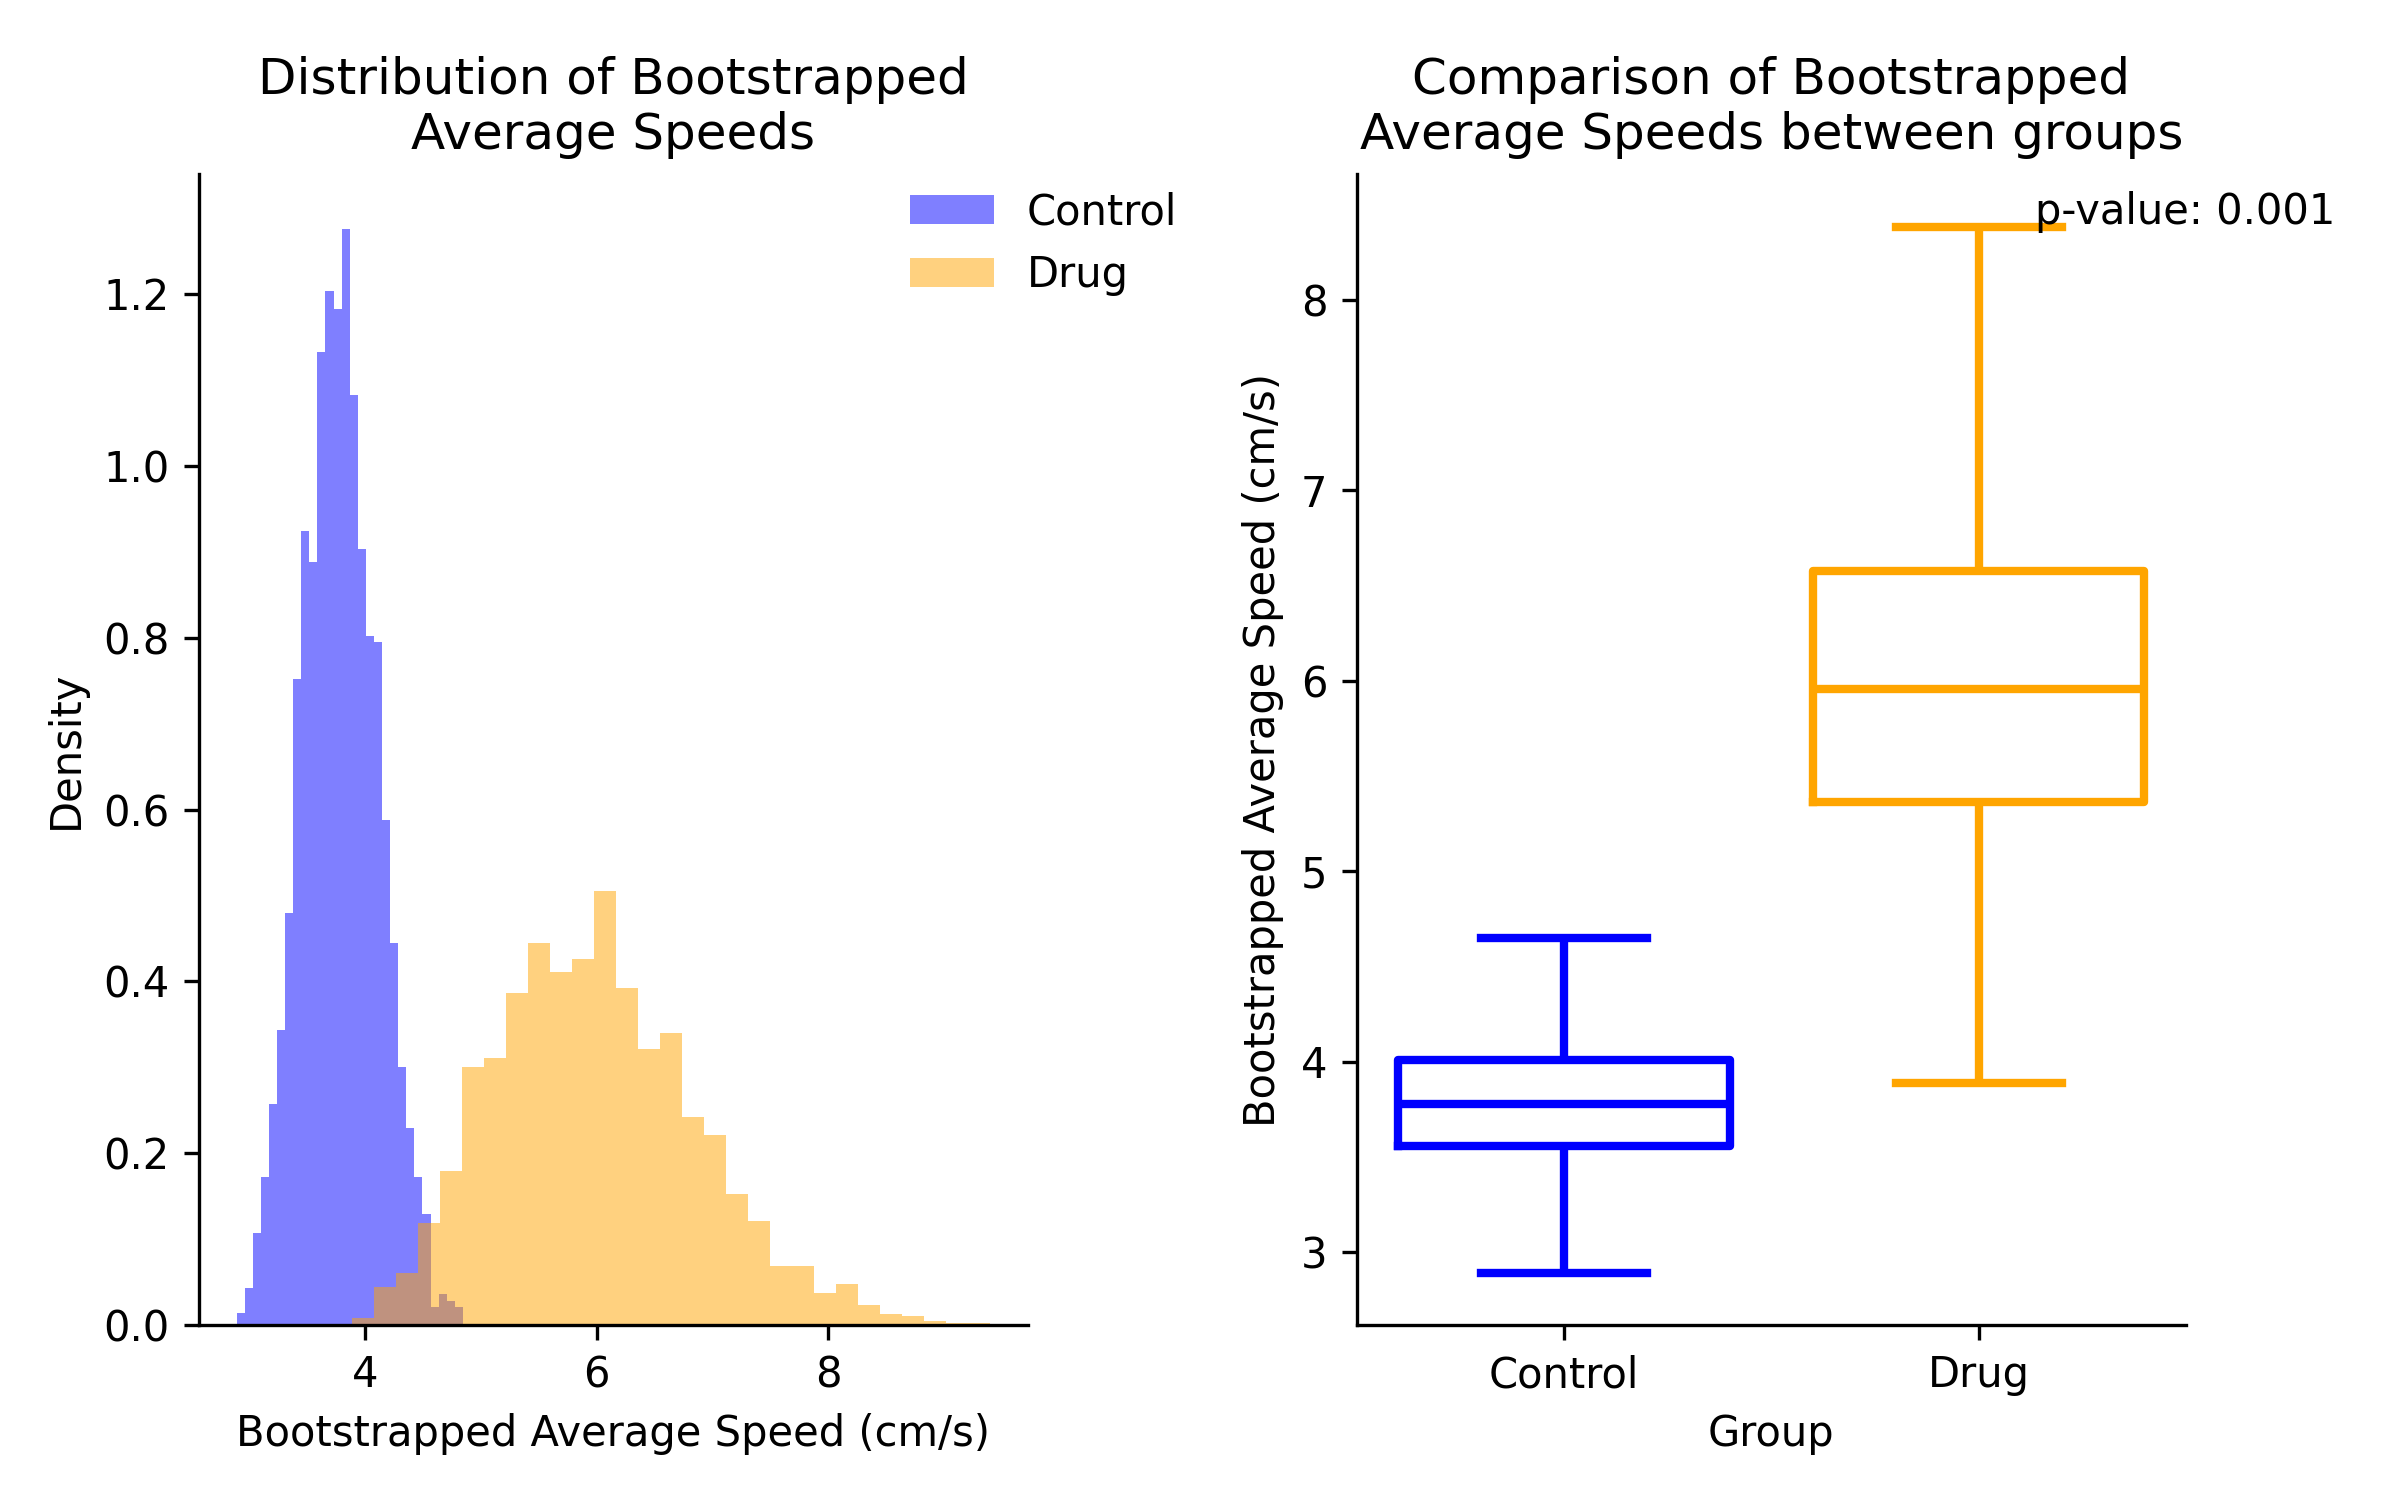
Comparison of speed estimates between group 1 and group 2. Left panel shows overlaid distributions of speed estimates. Right panel statistical result of comparison on a box plot
By Recording Data
The by recording method will output a csv file containing the average speed estimates for each recording in each group. The length of the file will be the number of recordings in all groups.
| Group | File Name | Speed |
|---|---|---|
| Control | locomotion_1.csv | 7.8265 |
| Control | locomotion_2.csv | 4.2917 |
| Drug | locomotion_3.csv | 6.1593 |
| Drug | locomotion_4.csv | 8.7451 |
By Recording Preview
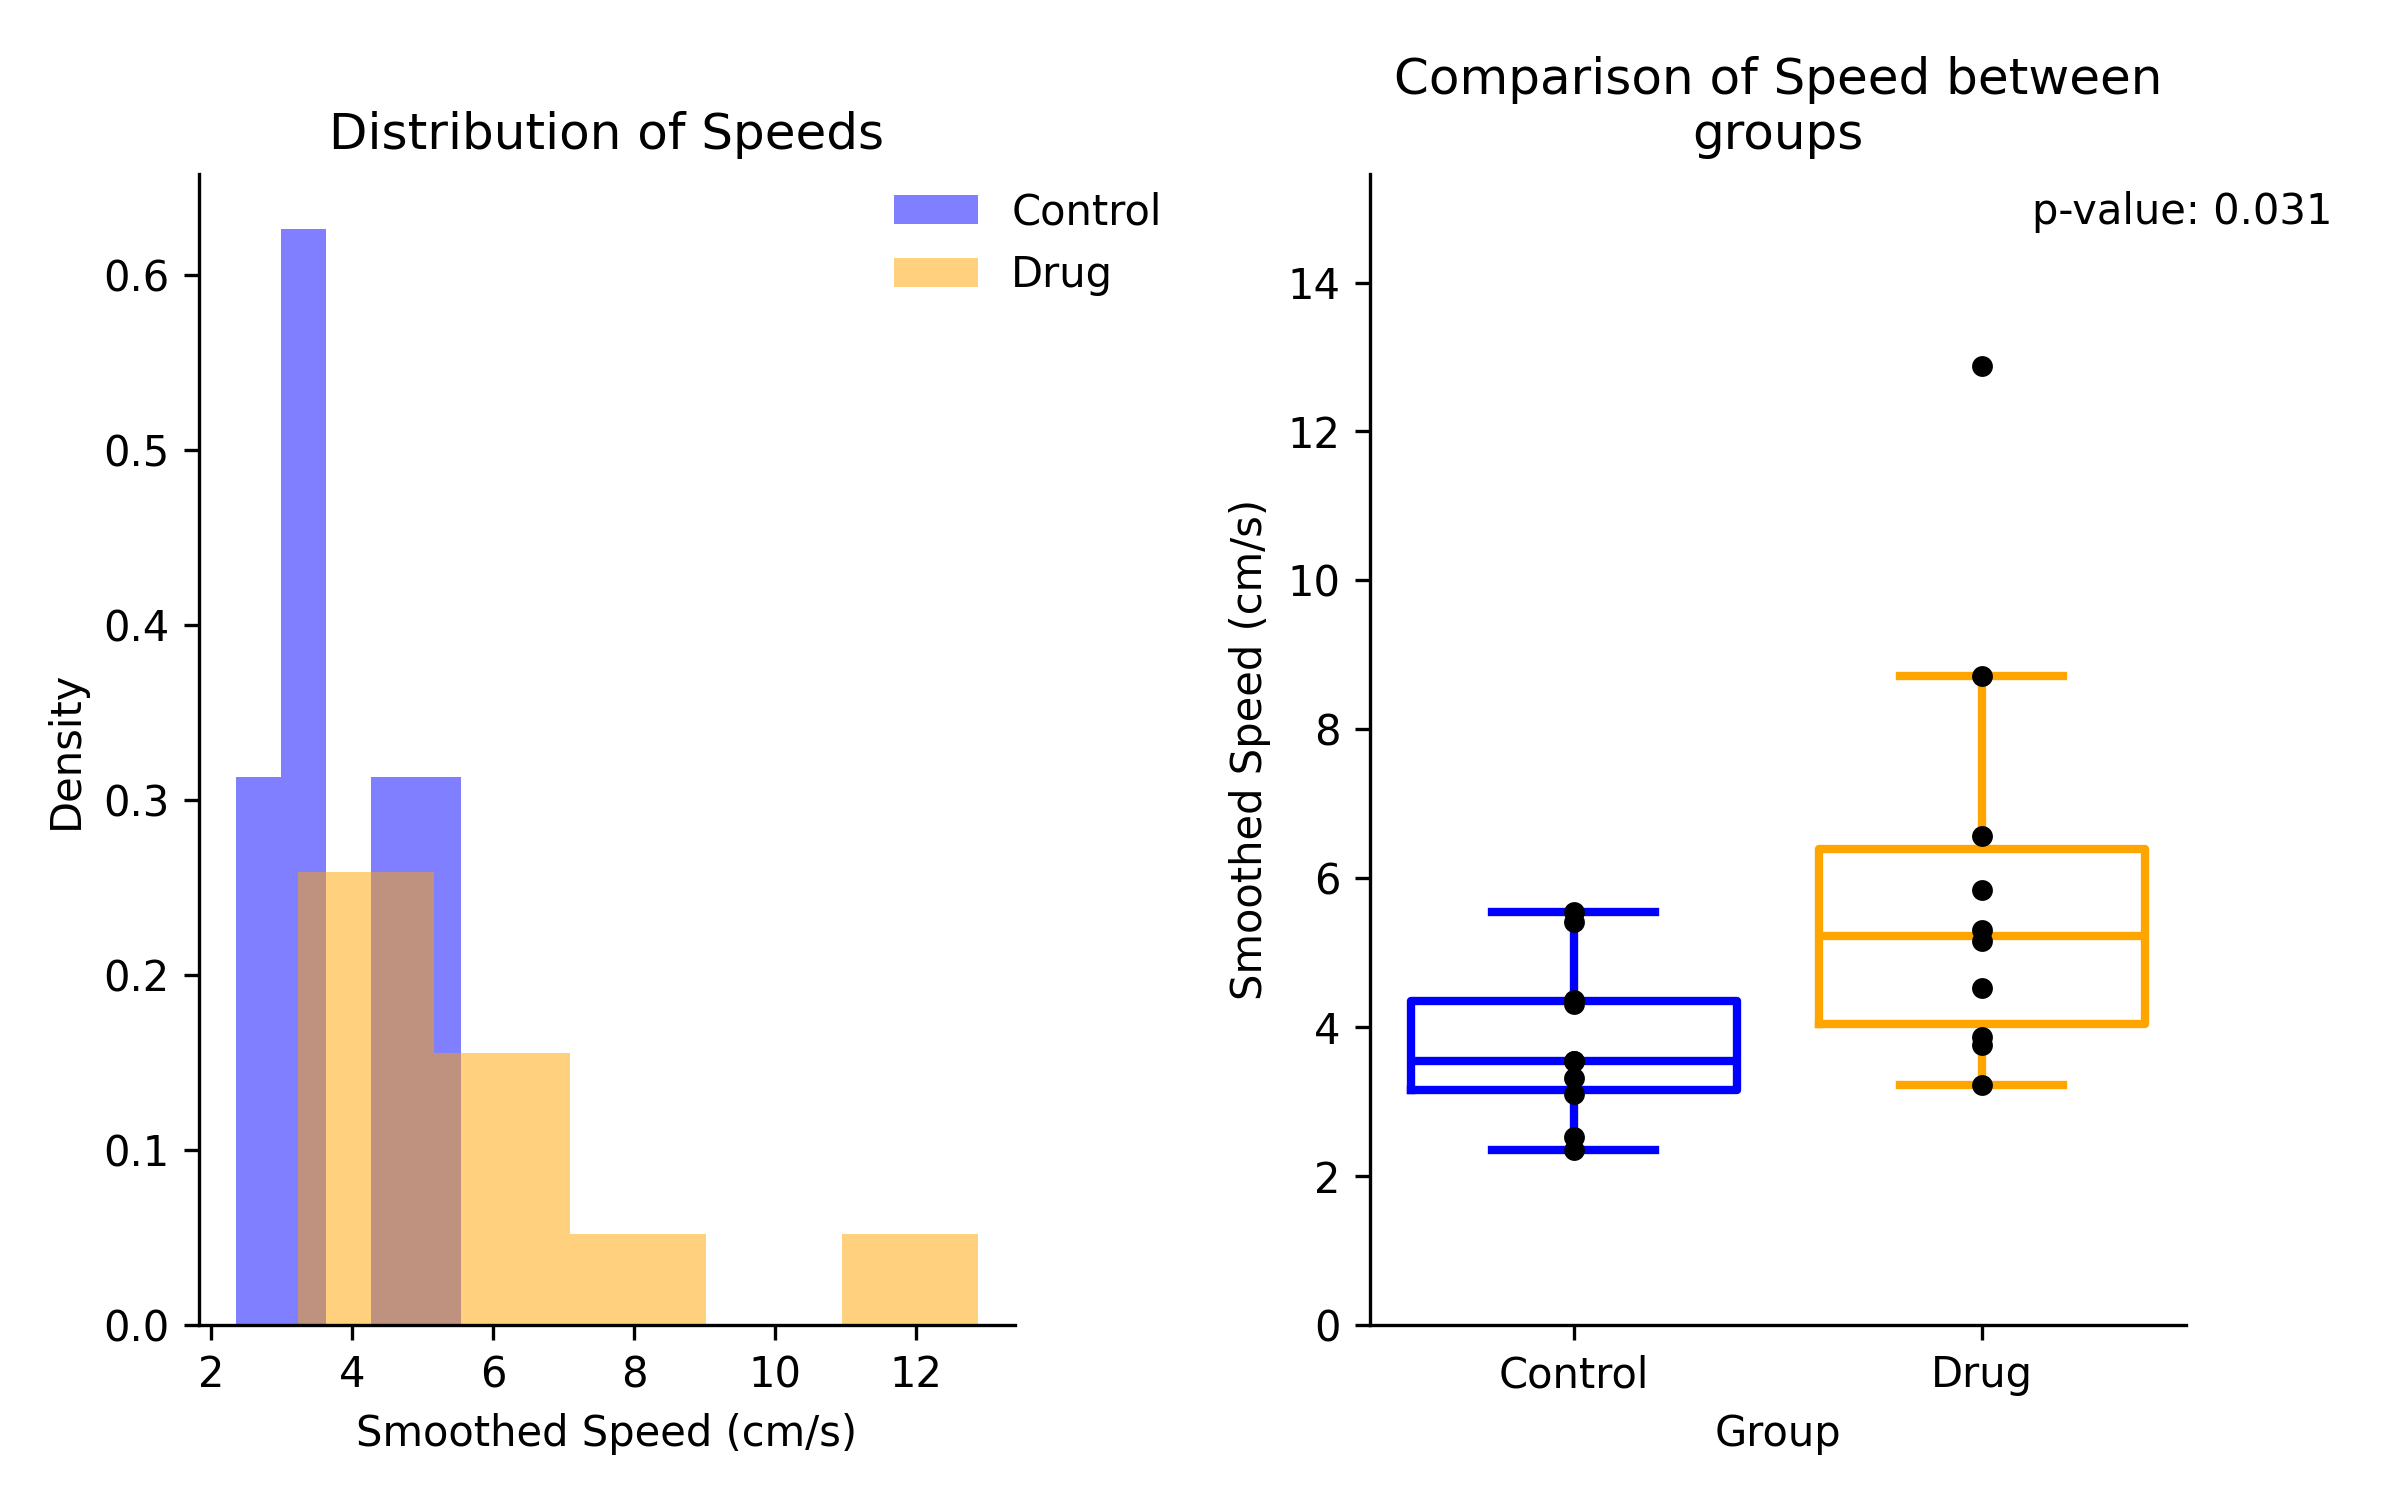
The by recording method will show the average speed estimates for each recording in each group. The box plot will include a strip plot of the average of each recording.
By Frame Data
The by frame method will output a csv file in IDEAS experiment annotations format containing the distribution of speed estimates for all frames in each group. The length of the file will be the number of frames in all groups.
| Group | File Name | Speed |
|---|---|---|
| Control | locomotion_1.csv | 0.7812 |
| Control | locomotion_1.csv | 0.4292 |
| Control | locomotion_1.csv | 0.6159 |
| Control | locomotion_1.csv | 0.8745 |
By Frame
The by frame method will show the distribution of speed estimates for all frames in each group.
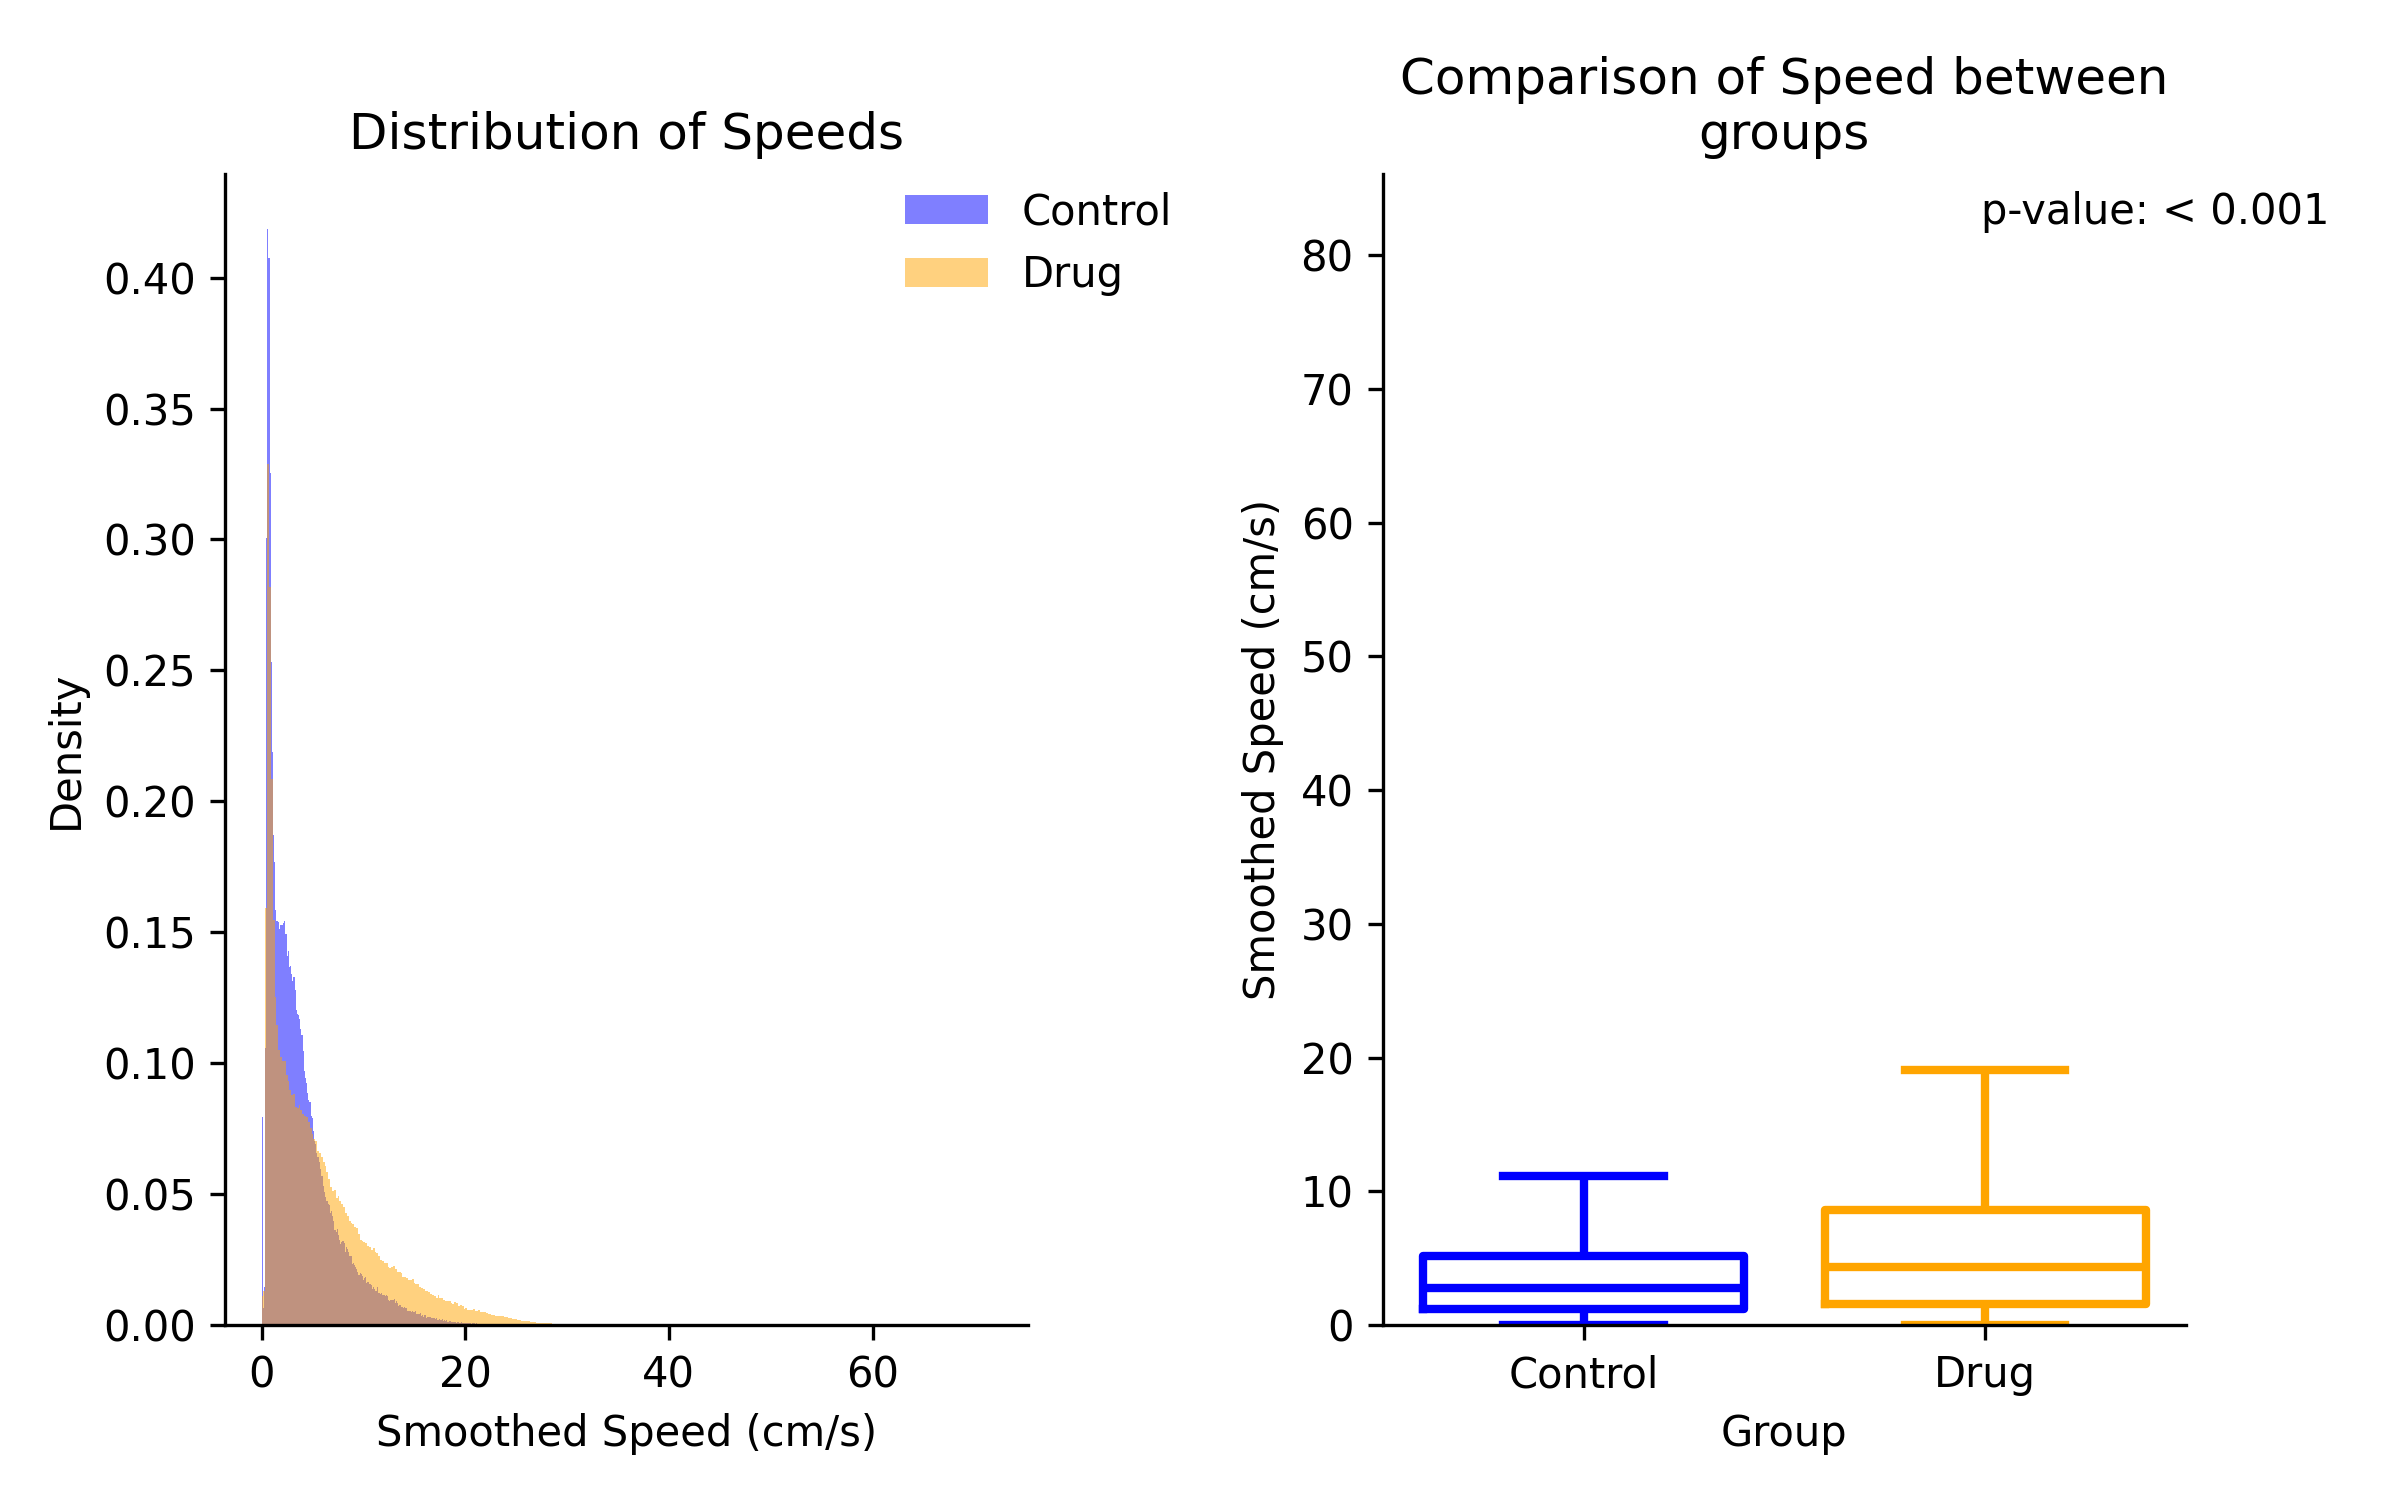
Comparison of speed estimates between group 1 and group 2. Left panel shows overlaid distributions of speed estimates. Right panel statistical result of comparison on a box plot
Move vs Rest State Comparison Outputs
Hierarchical Bootstrapping Method Data
The hierarchical bootstrapping method will output a csv file containing the distribution of the percent time moving between group 1 and group 2 for move and rest states. The estimates for moving and resting are calculated independently. The length of the file will be 2 * N Bootstraps.
| Group | Moving | Resting |
|---|---|---|
| Control | 0.2401 | 0.0365 |
| Control | 0.4823 | 0.1807 |
| Drug | 0.0936 | 0.2948 |
| Drug | 0.4019 | 0.4982 |
Hierarchical Bootstrapping Method Preview
The hierarchical bootstrapping method will show the distribution of the average percent time moving between group 1 and group 2 for move (left), and rest (right).
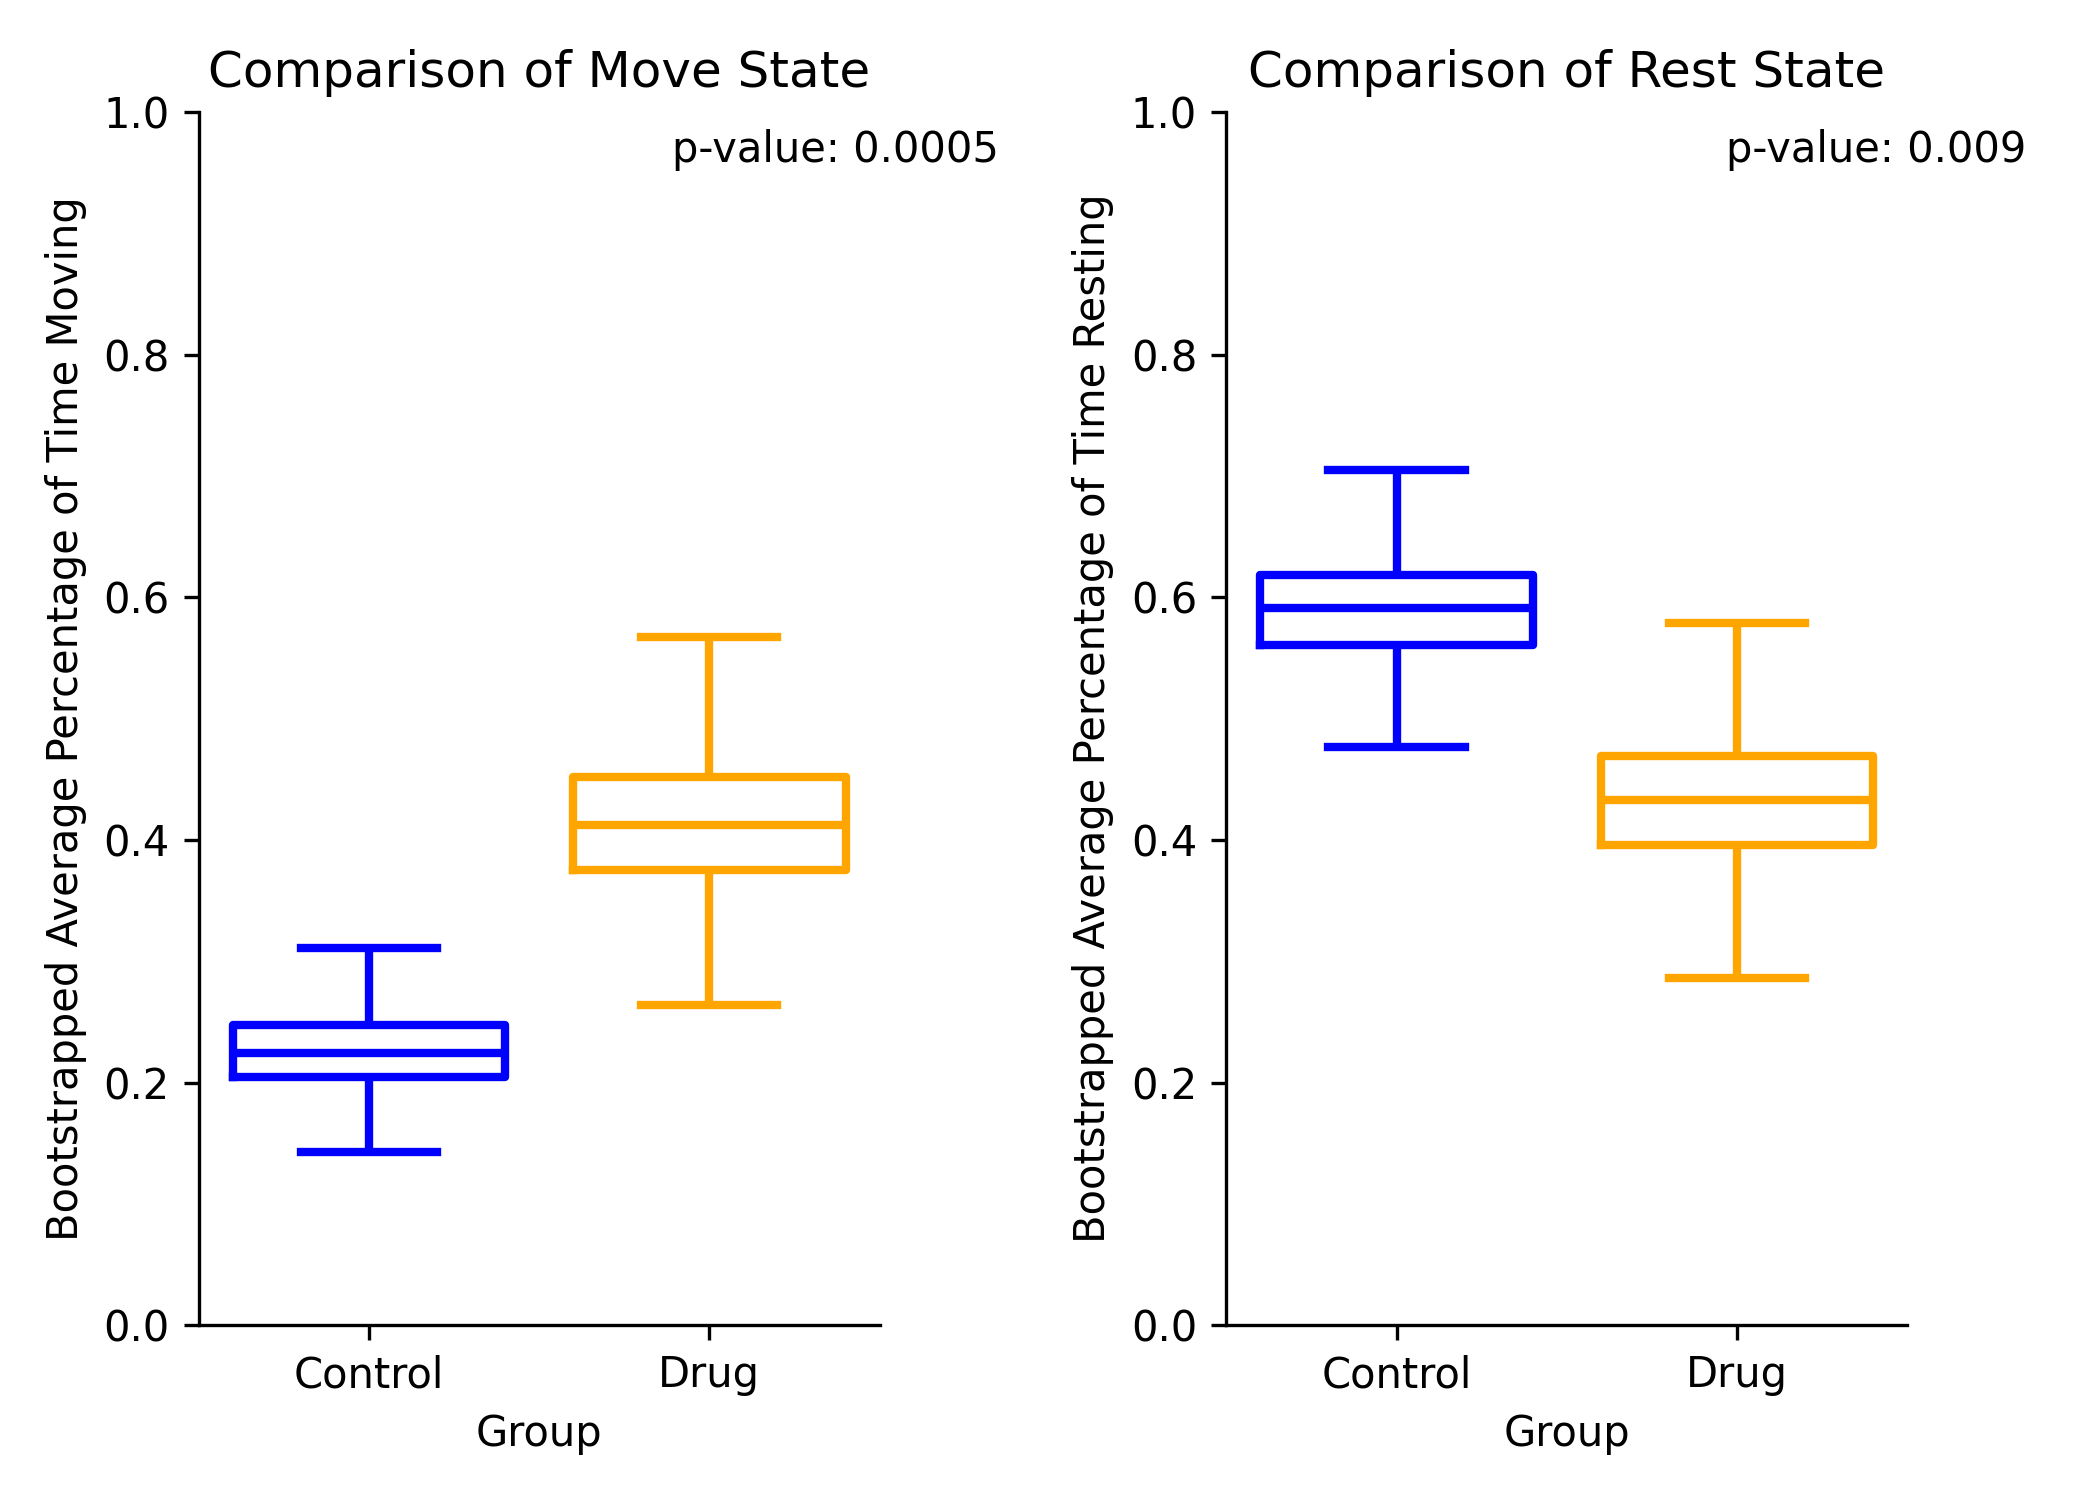
Comparison of the percent time moving between group 1 and group 2 for move (left), and rest (right)
By Recording Data
The by recording method will output a csv file containing the percent time moving between group 1 and group 2 for move and rest states. The estimates for moving and resting are calculated independently. The length of the file will be the number of total recordings
| Group | File Name | Moving | Resting |
|---|---|---|---|
| Control | locomotion_1.csv | 0.2401 | 0.0365 |
| Drug | locomotion_2.csv | 0.4823 | 0.1807 |
| Control | locomotion_3.csv | 0.0936 | 0.2948 |
| Drug | locomotion_4.csv | 0.4019 | 0.4982 |
By Recording Preview
The by recording method will show the average percent time moving and resting per recording between group 1 and group 2 for move (left), and rest (right). These plots will include a strip plot of the average of each recording.
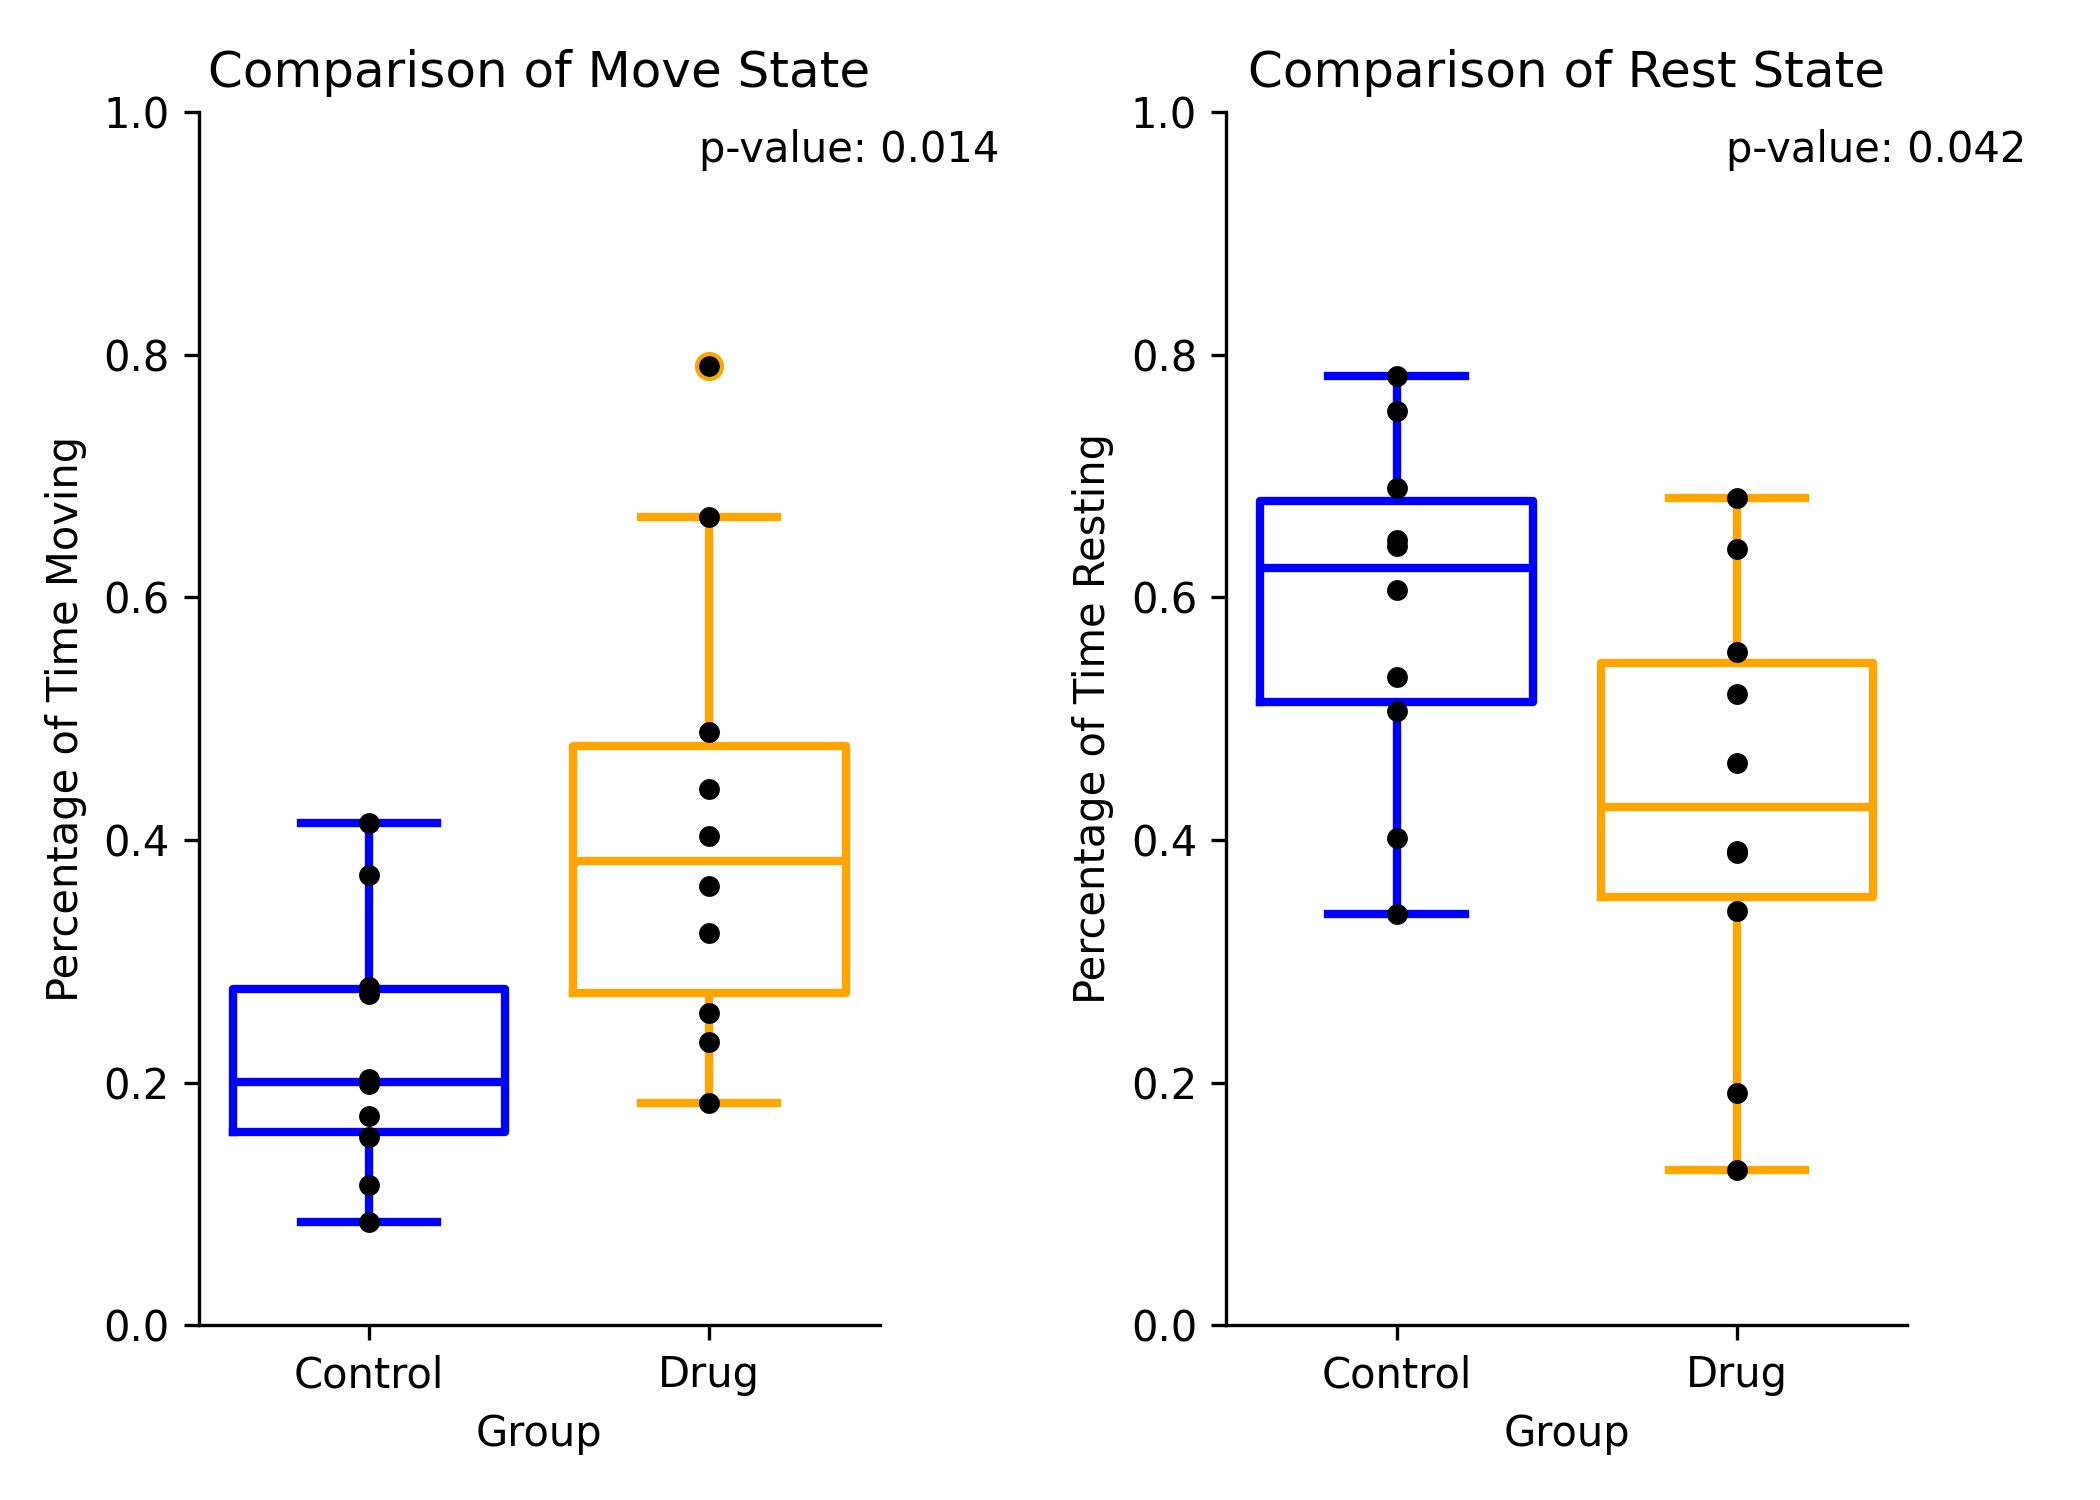
Comparison of the percent time moving between group 1 and group 2 for move (left), and rest (right)
By Frame Data
The by frame method will output a csv file containing a boolean value whether the subject was moving or resting as a boolean value for every frame in all recordings for both groups. The length of the file will be the number of total frames in all recordings.
| Group | File Name | Moving | Resting |
|---|---|---|---|
| Control | locomotion_1.csv | 0 | 1 |
| Control | locomotion_1.csv | 0 | 1 |
| Control | locomotion_1.csv | 0 | 1 |
| Control | locomotion_1.csv | 0 | 0 |
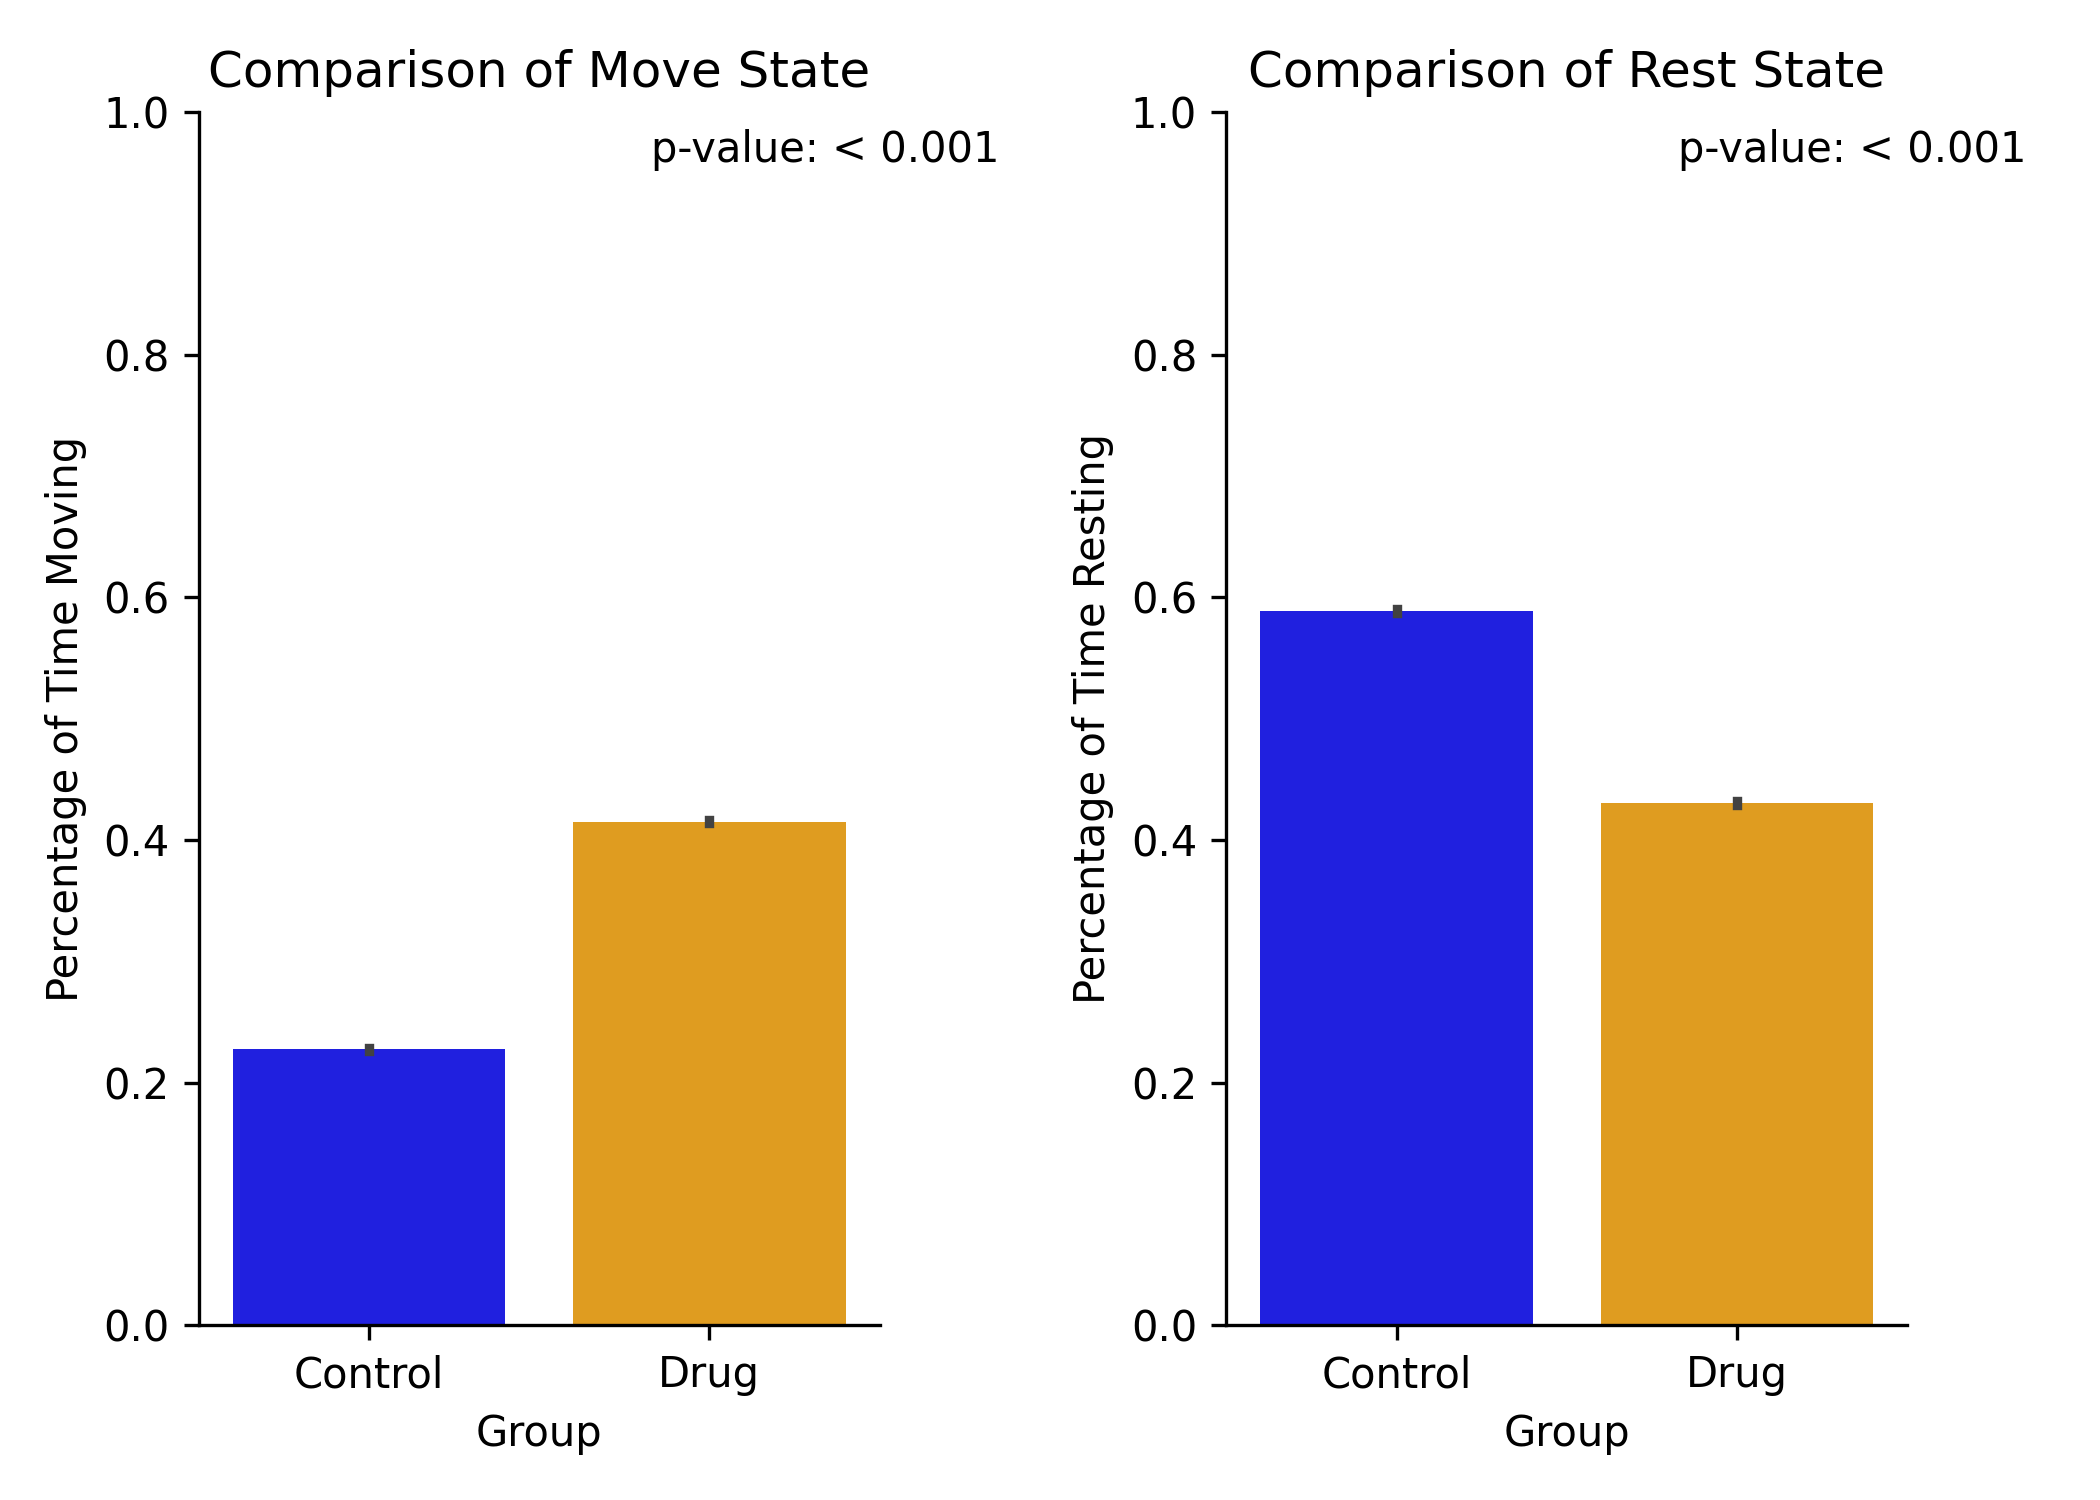
By Frame Preview
The by frame method will show a bar chart of the total proportion of time spent moving, resting, or undefined for each group (mean ± sem).
FAQ
| Question | Answer |
|---|---|
| What are the advantages of using the hierarchical bootstrapping method? | The hierarchical bootstrapping method is a non-parametric method that does not assume normality of the data. It is especially useful if you have a small sample size or if the data is not normally distributed. Furthermore, the hierarchical bootstrapping method is agnostic to the length of the recordings, as it resamples the data at the level of the individual recordings. |
| Why does my data look different when using the hierarchical bootstrapping method? | The plots using hierarchical bootstrapping method will look different because the data being ploted is a distribution of mean estimates rather than the raw values. |
| Why is the p-value different when using the hierarchical bootstrapping method? | Your p-value may differ between the hierarchical bootstrapping method and the non-hierarchical bootstrapping method because the hierarchical bootstrapping is reliant on the number of iterations specified by the N Bootstraps parameter. The more iterations you perform, the more accurate the p-value will be. The non-hierarchical bootstrapping method is reliant on number of total frames or the number of recordings. |
-
Saravanan, V., Berman, G. J., & Sober, S. J. (2020). Application of the hierarchical bootstrap to multi-level data in neuroscience. Neurons, behavior, data analysis, and theory, 3(5), https://nbdt.scholasticahq.com/article/13927-application-of-the-hierarchical-bootstrap-to-multi-level-data-in-neuroscience. ↩↩↩
-
D’Agostino, R. B. (1971), “An omnibus test of normality for moderate and large sample size”, Biometrika, 58, 341-348 ↩
-
D’Agostino, R. and Pearson, E. S. (1973), “Tests for departure from normality”, Biometrika, 60, 613-622 ↩