CaImAn Spike Extraction
This tool uses 0.5 compute credits per hour.
Overview
The CaImAn spike extraction tool infers and extracts neural spikes and biosensor kinetics (e.g. GCaMP activity) from noisy calcium imaging fluorescent time-series data using constrained deconvolution1 as implemented in the open-source package CaImAn2.
Inputs
The workflow supports individual cell sets and cell set series. When a cell set series is provided, each cell set will be processed independently and the number of output files will match the number of input files.
The input files and processing parameters are listed in the table below.
Parameters
| Parameter | Required? | Default | Description |
|---|---|---|---|
| Cell Set(s) | True | N/A | Single cell set or cell set series |
| bl | False | auto | Fluorescence baseline value. If set to 'auto', it will be estimated from the data. |
| c1 | False | auto | Value of calcium at time 0. If set to 'auto', it will be set based on the data. |
| g | False | auto | Parameters of the autoregressive process that models the fluorescence impulse response. The parameters should be specified as comma-separated value (e.g. 5,10). If set to 'auto', it will be estimated from the data. |
| sn | False | auto | Standard deviation of the noise distribution. If set to 'auto', it will be estimated from the data. |
| p | False | 1 | Order of the autoregressive model used to deconvolve the indicator temporal dynamics |
| method_deconvolution | False | oasis | Method for solving the constrained deconvolution of temporal traces |
| bas_nonneg | False | True | If True, a non-negative baseline will be used. If False, the baseline will be greater than or equal to the minimum value, which could be negative. |
| noise_method | False | logmexp | Power spectrum averaging method used for noise estimation |
| noise_range | False | 0.25,0.5 | Range of normalized frequencies over which to compute the power spectrum for noise estimation. The range should be specified as 'fmin,fmax', where fmin and fmax refer to the minimum and maximum of the normalized frequency range to use (e.g.: 0.25,0.5). |
| s_min | False | N/A | Minimum spike threshold amplitude. For negative values the threshold is abs(s_min) * sn * sqrt(1-g). If unspecified, the standard L1 penalty is used. If set to 0, the threshold is determined automatically such that RSS <= sn^2 T. |
| optimize_g | True | False | If True, the time constants will be optimized. This applies only to the 'oasis' deconvolution method. |
| fudge_factor | False | 0.96 | Bias correction factor for the discrete time constants |
| lags | False | 5 | Number of lags for estimating the time constants of the autoregressive model. This should be an integer between 1 and the number of timepoints in the data. |
| solvers | False | ECOS,SCS | Primary and secondary solvers to use with the 'cvxpy' deconvolution method. This should be specified as 'solver1,solver2', where solver1 and solver1 refer to the primary and secondary solvers (e.g.: ECOS,SCS). The solvers should be one of the following values: 'ECOS', 'SCS', and 'CVXOPT'. |
Outputs
The workflow will produce the outputs listed below.
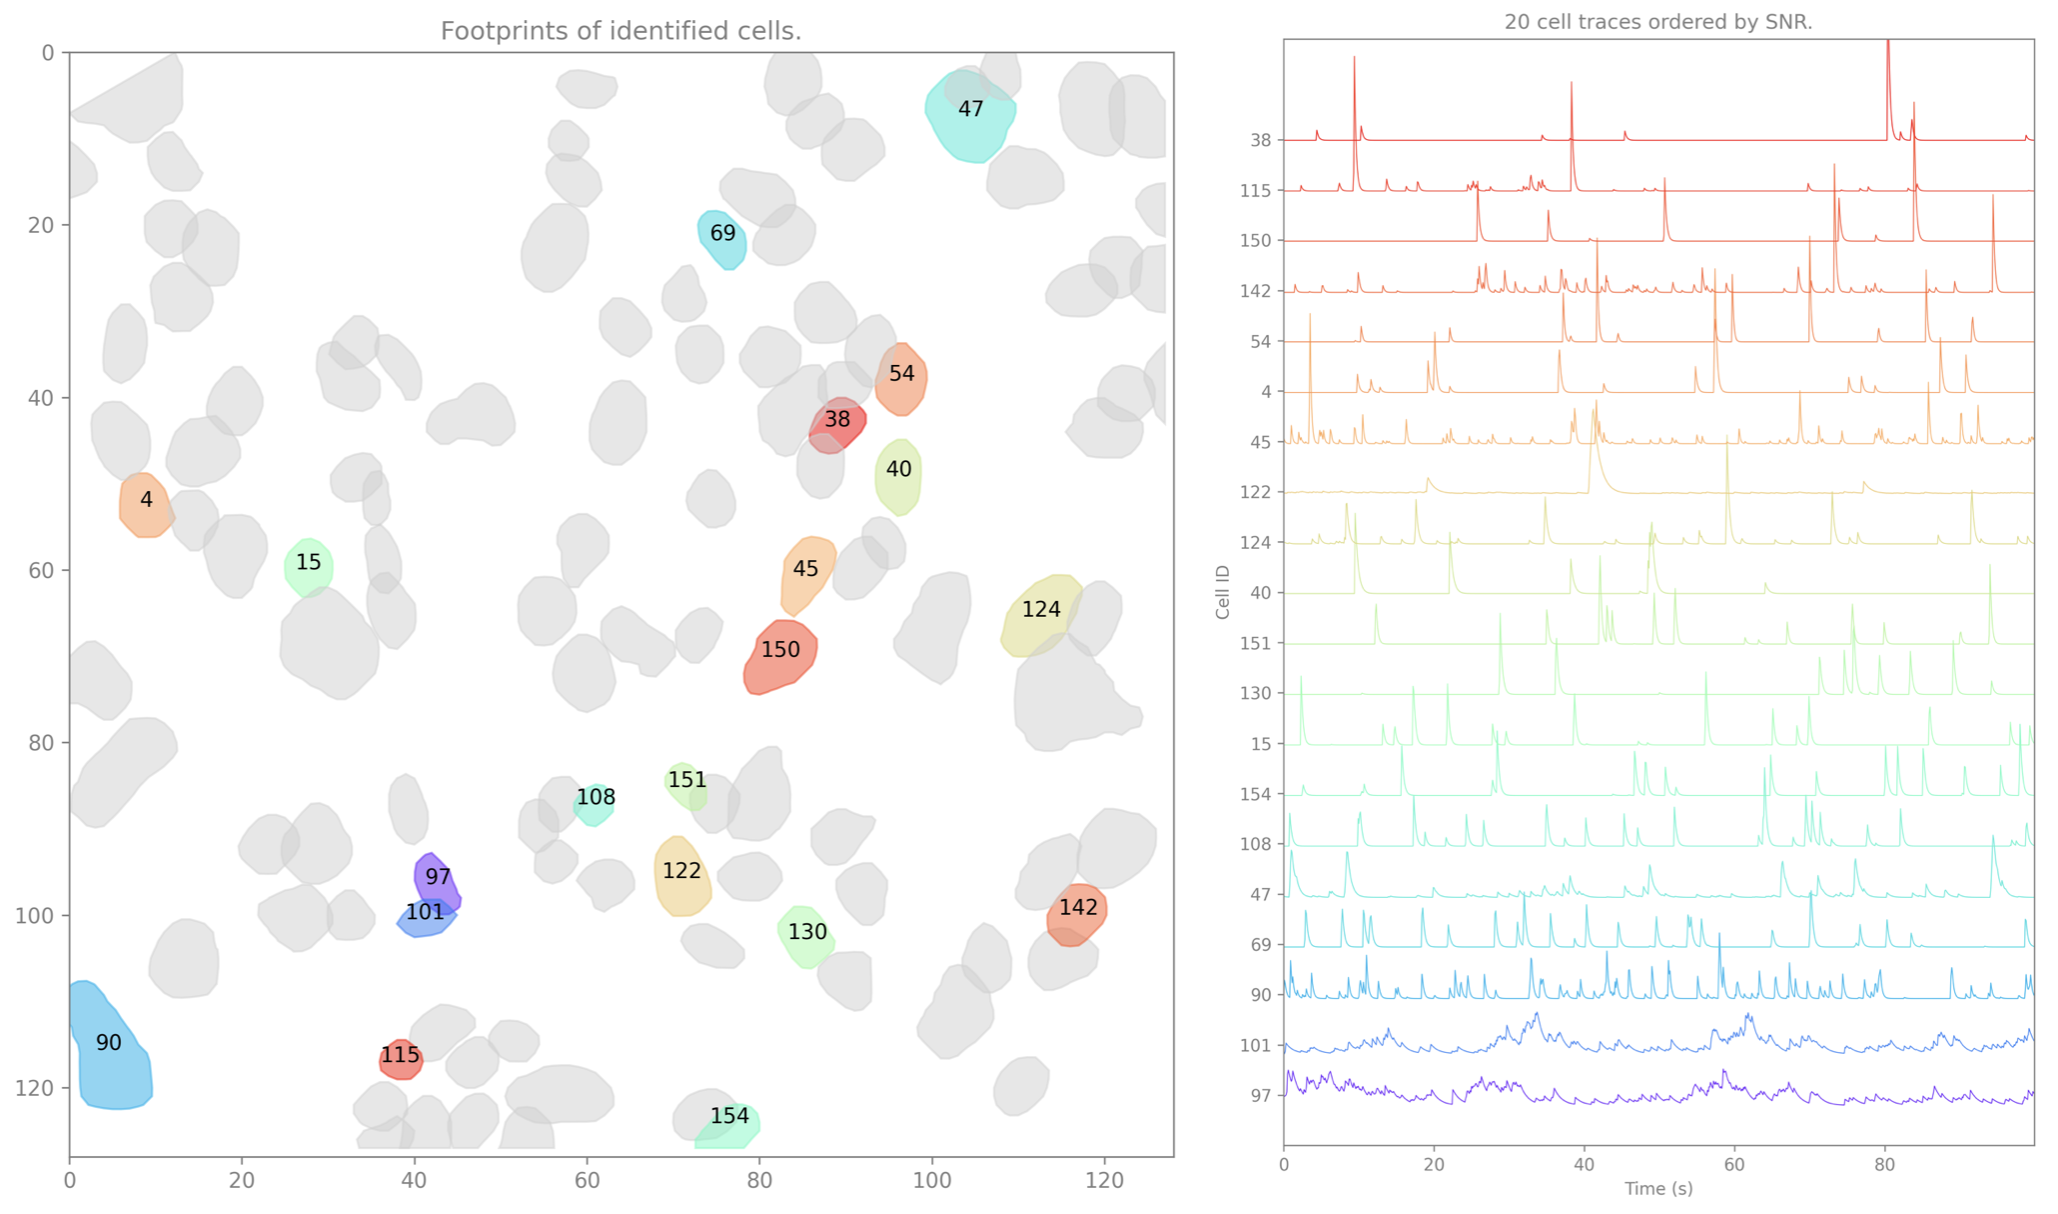
Denoised Cell Set(s)
isxd cell set(s) containing the spatial footprints and denoised temporal traces.
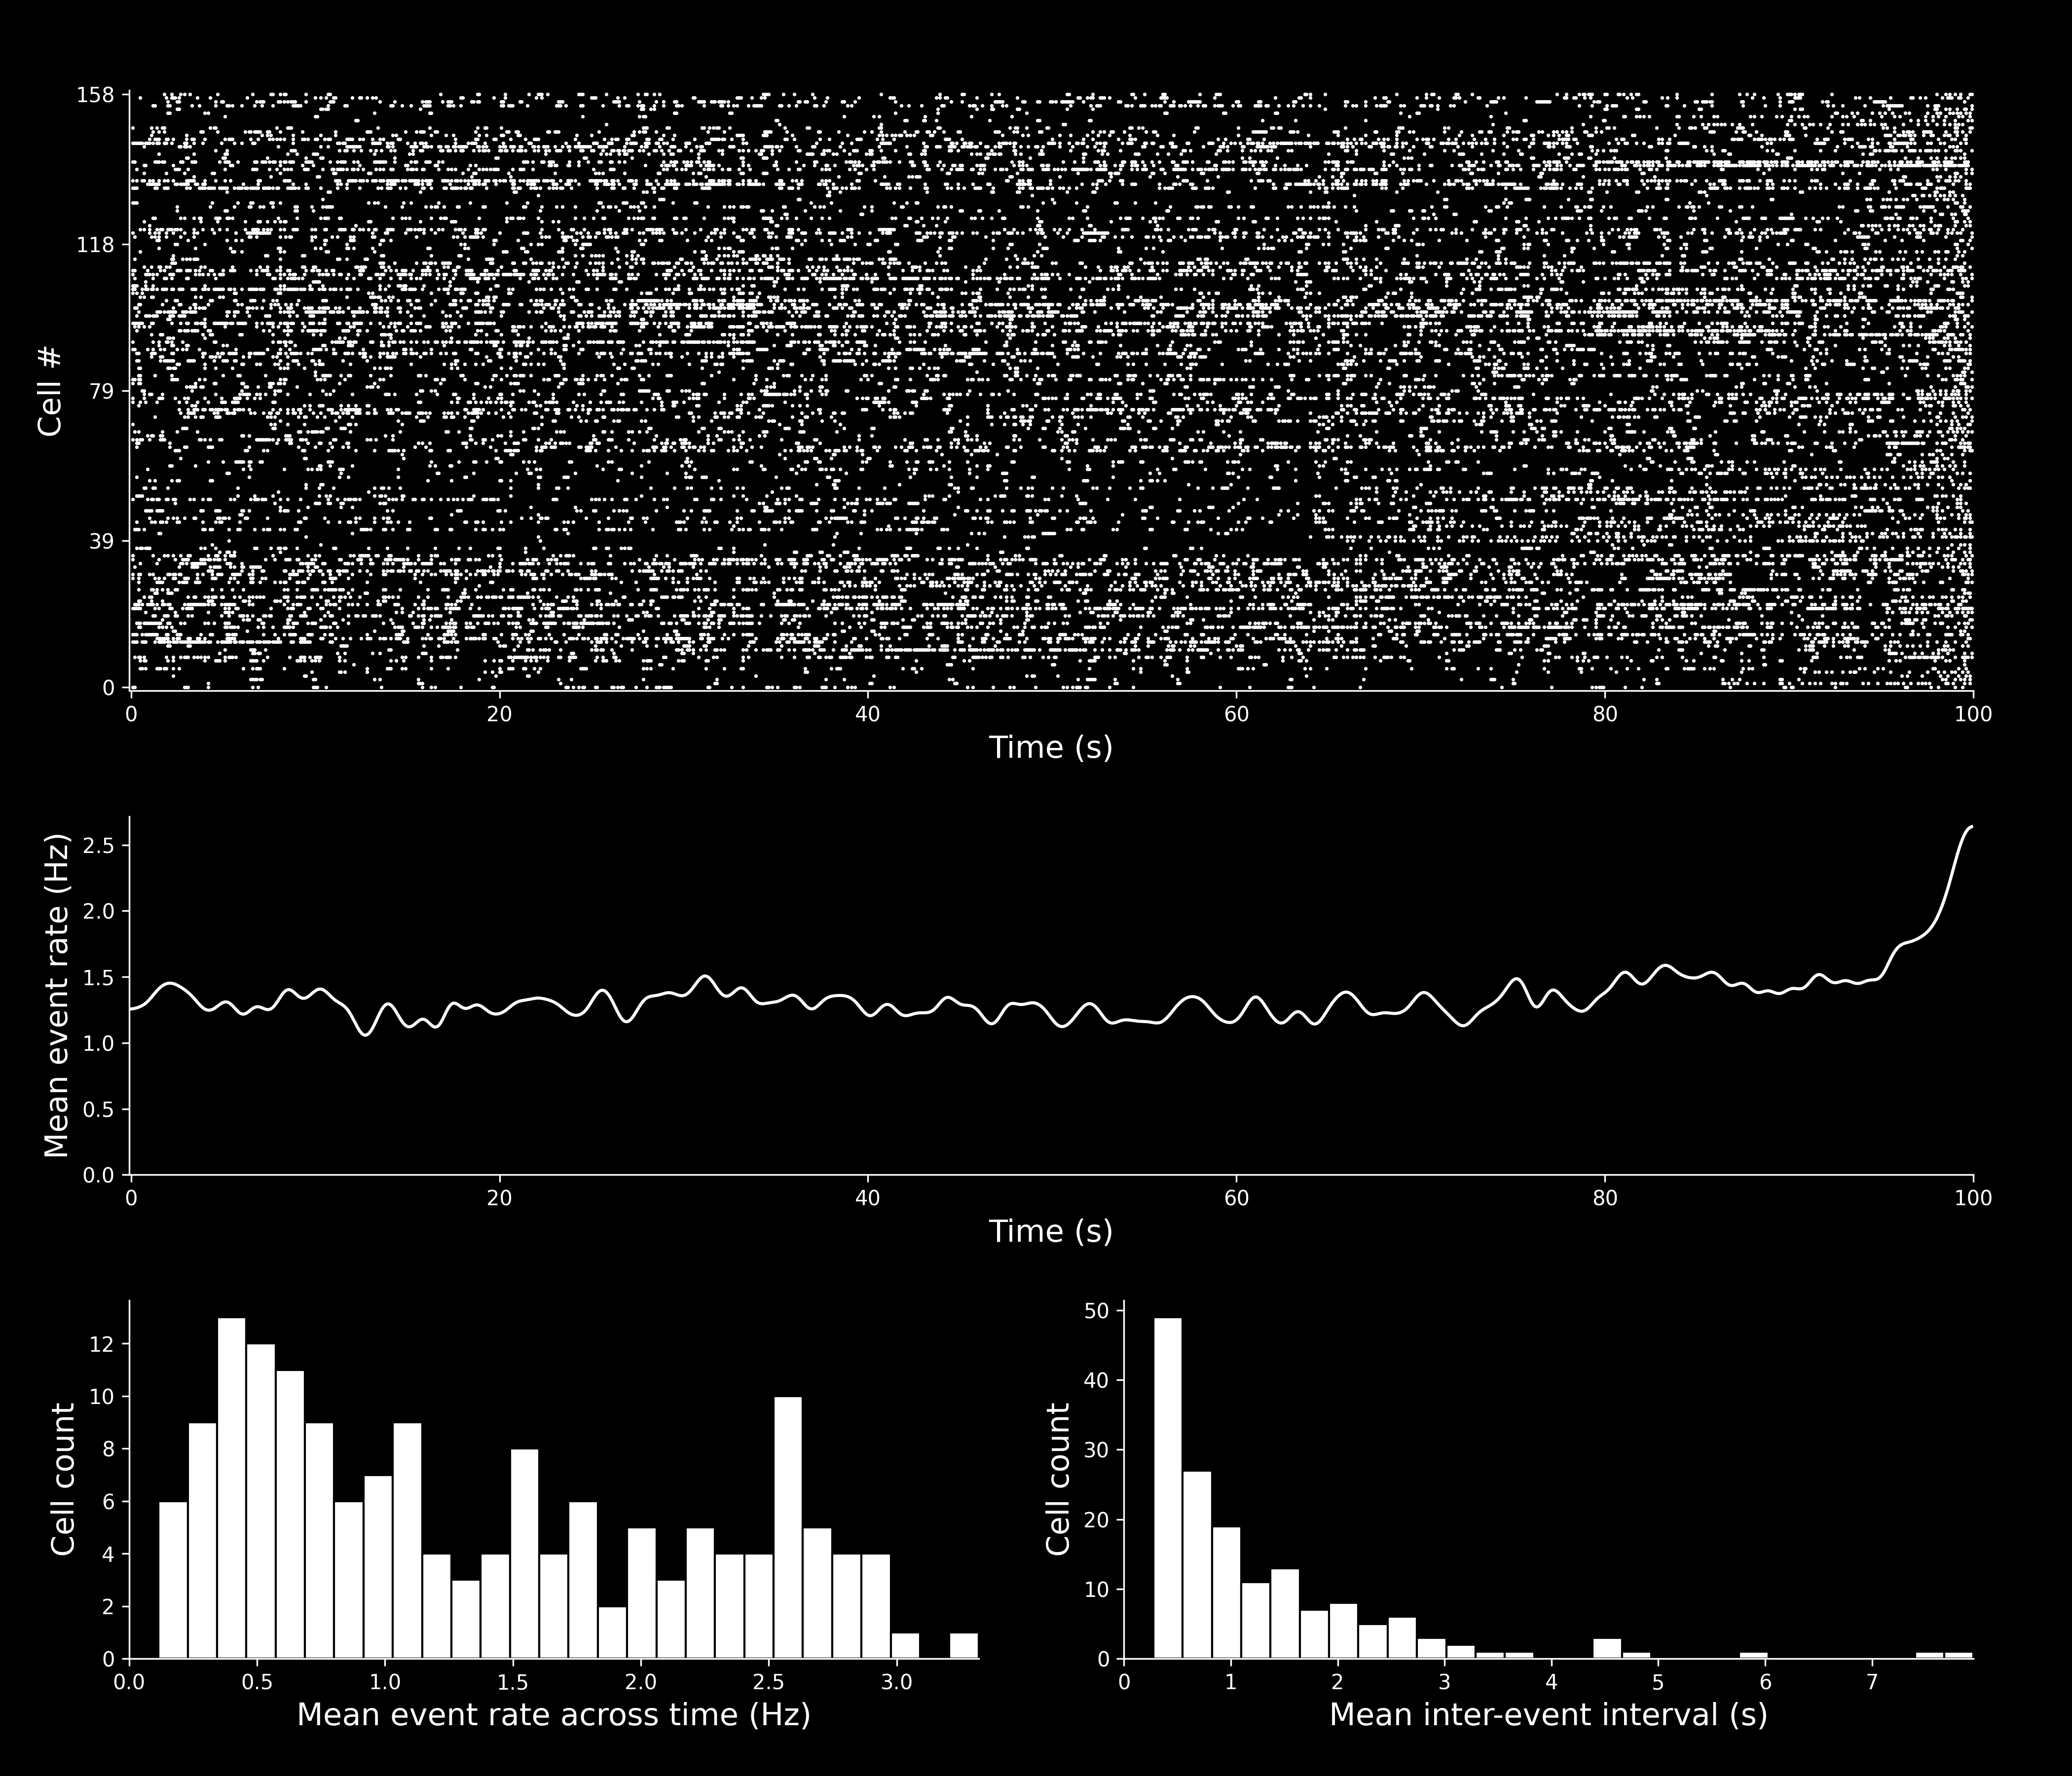
Spike Event Set(s)
isxd event set(s) containing the neural events identified by CaImAn.