Combine and Compare Correlation Data
This tool uses 1.0 compute credits per hour.
Overview
This tool is used to combine correlation data from multiple recordings and perform a statistical comparison between two groups across two states to determine if there is a difference either in the maximum cell-to-cell correlation or in the effect size."
Parameters
| Parameter | Required? | Default | Description |
|---|---|---|---|
| Correlation Data Files | True | N/A | Select correlation data from the first group to use for analysis |
| Name | True | group1 | Name of the first group |
| Correlation Data Files | False | N/A | Select correlation data from the second group to use for analysis |
| Name | False | N/A | Name of the second group |
| Comparison Type | False | N/A | Type of statistical test to perform |
| Data Pairing | False | N/A | Indicates whether observations should be paired for statistical comparison |
Valid Inputs
| Source Parameter | File Type | File Format |
|---|---|---|
| Correlation Data Files | correlation_data | csv |
| Correlation Data Files | correlation_data | csv |
Algorithm Description
The workflow is summarized using a flowchart below.
The workflow begins by combining the data in the first input group. If no data is selected for the second input group, the workflow terminates upon combining the data from the first group. If data is selected for the second group, that data will be combined independently of the first group. Finally, the two groups are compared to determine if there is statistically significant difference between them.
Combination
The combination step is performed independently for each input group. The process starts with the aggregation of the data from all recordings in the group, creating a population of cells. The cumulative distribution function and maximum pairwise correlation is then computed and plotted the same way it is done in the Compare Neural Circuit Correlations Across States tool.
Comparison
The effect size is computed for each recording by dividing the difference between the group means by the standard deviation of the data. The resulting value provides a metric for measuring effect size and is referred to as Cohen's d. A t-test is then performed to compare the means of the two groups. Similarly, the maximum cell-to-cell correlation is averaged across all cells for each state and each recording. A t-test is used to compare the means of the two groups. The t-statistic and corresponding p-value is reported for each statistical test. We specifically test for the null hypothesis that the two groups have identical average values. The alternative hypothesis tested is determined by the comparison type parameter as described in the table below.
| Comparison Type | Alternative Hypothesis Tested |
|---|---|
| One-Tailed (Less) | max cell-to-cell correlation (or effect size) in the first group is less than the second group |
| One-Tailed (Greater) | max cell-to-cell correlation (or effect size) in the first group is greater than the second group |
| Two-Tailed (Unequal) | max cell-to-cell correlation (or effect size) in the first group is different from the second group, i.e. max cell-to-cell correlation (or effect size) in the the first group is either less than or greater than the second group |
Output Figures
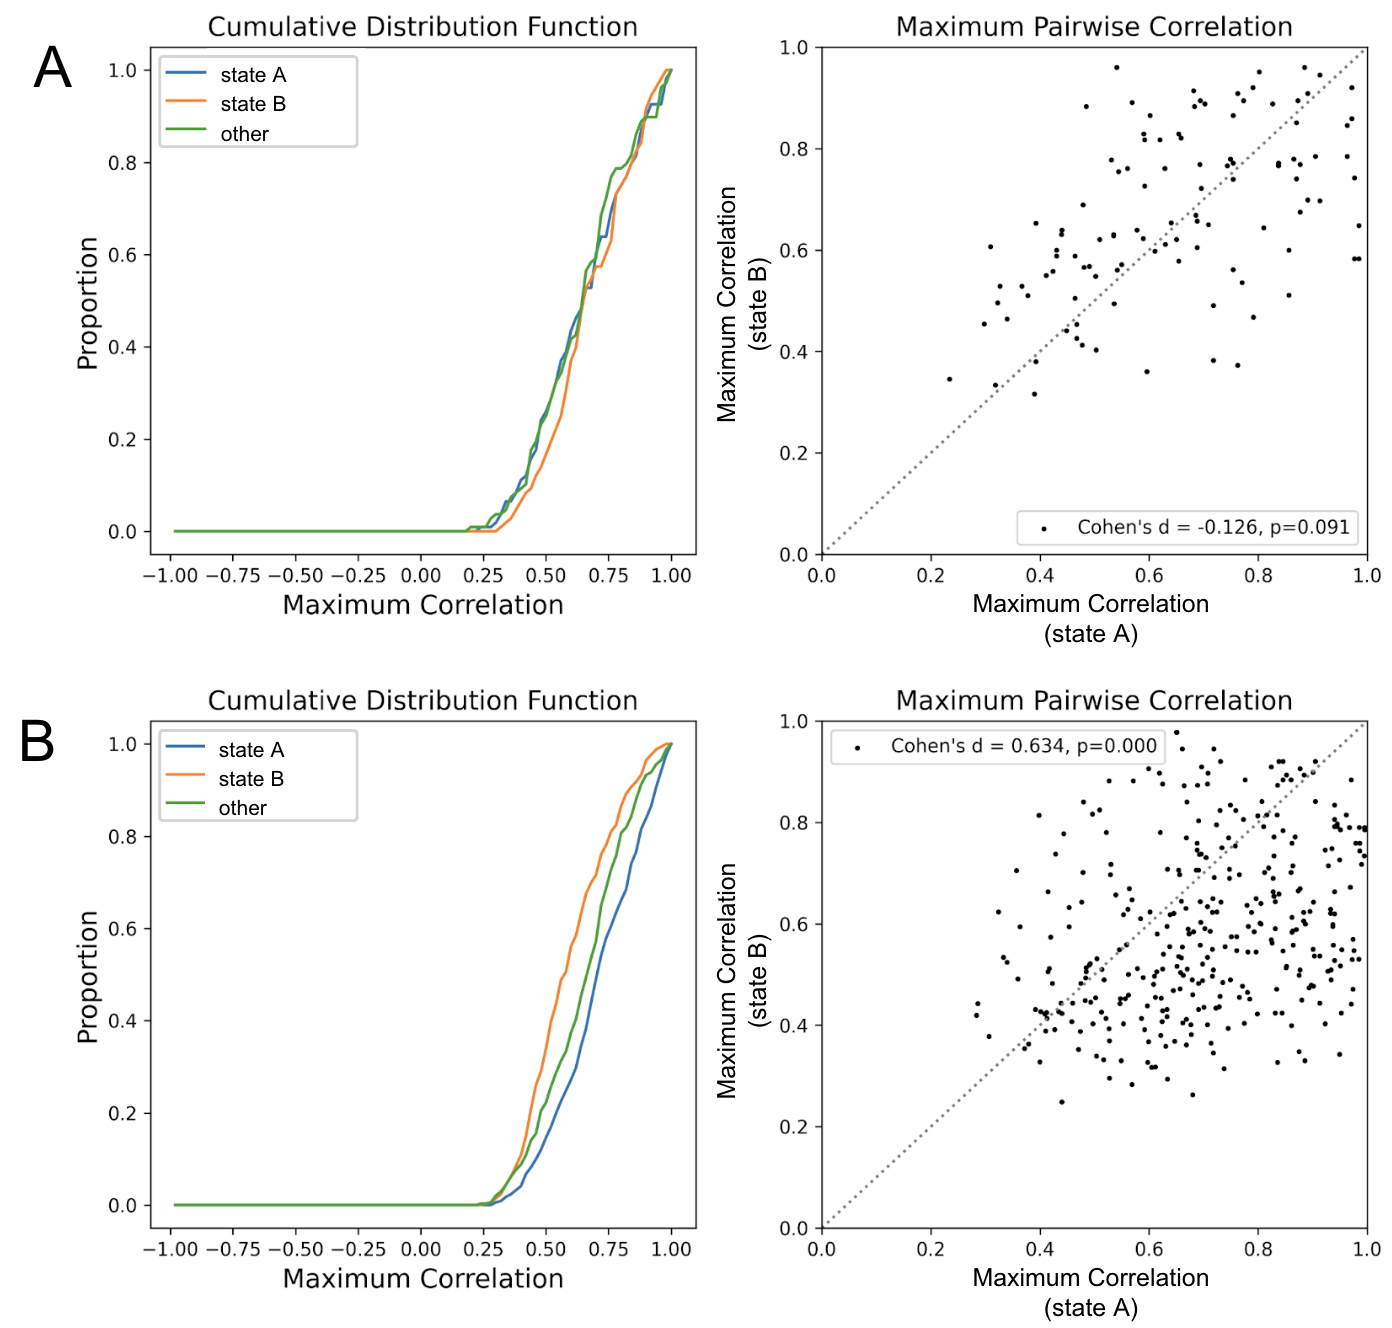
Combination Figures
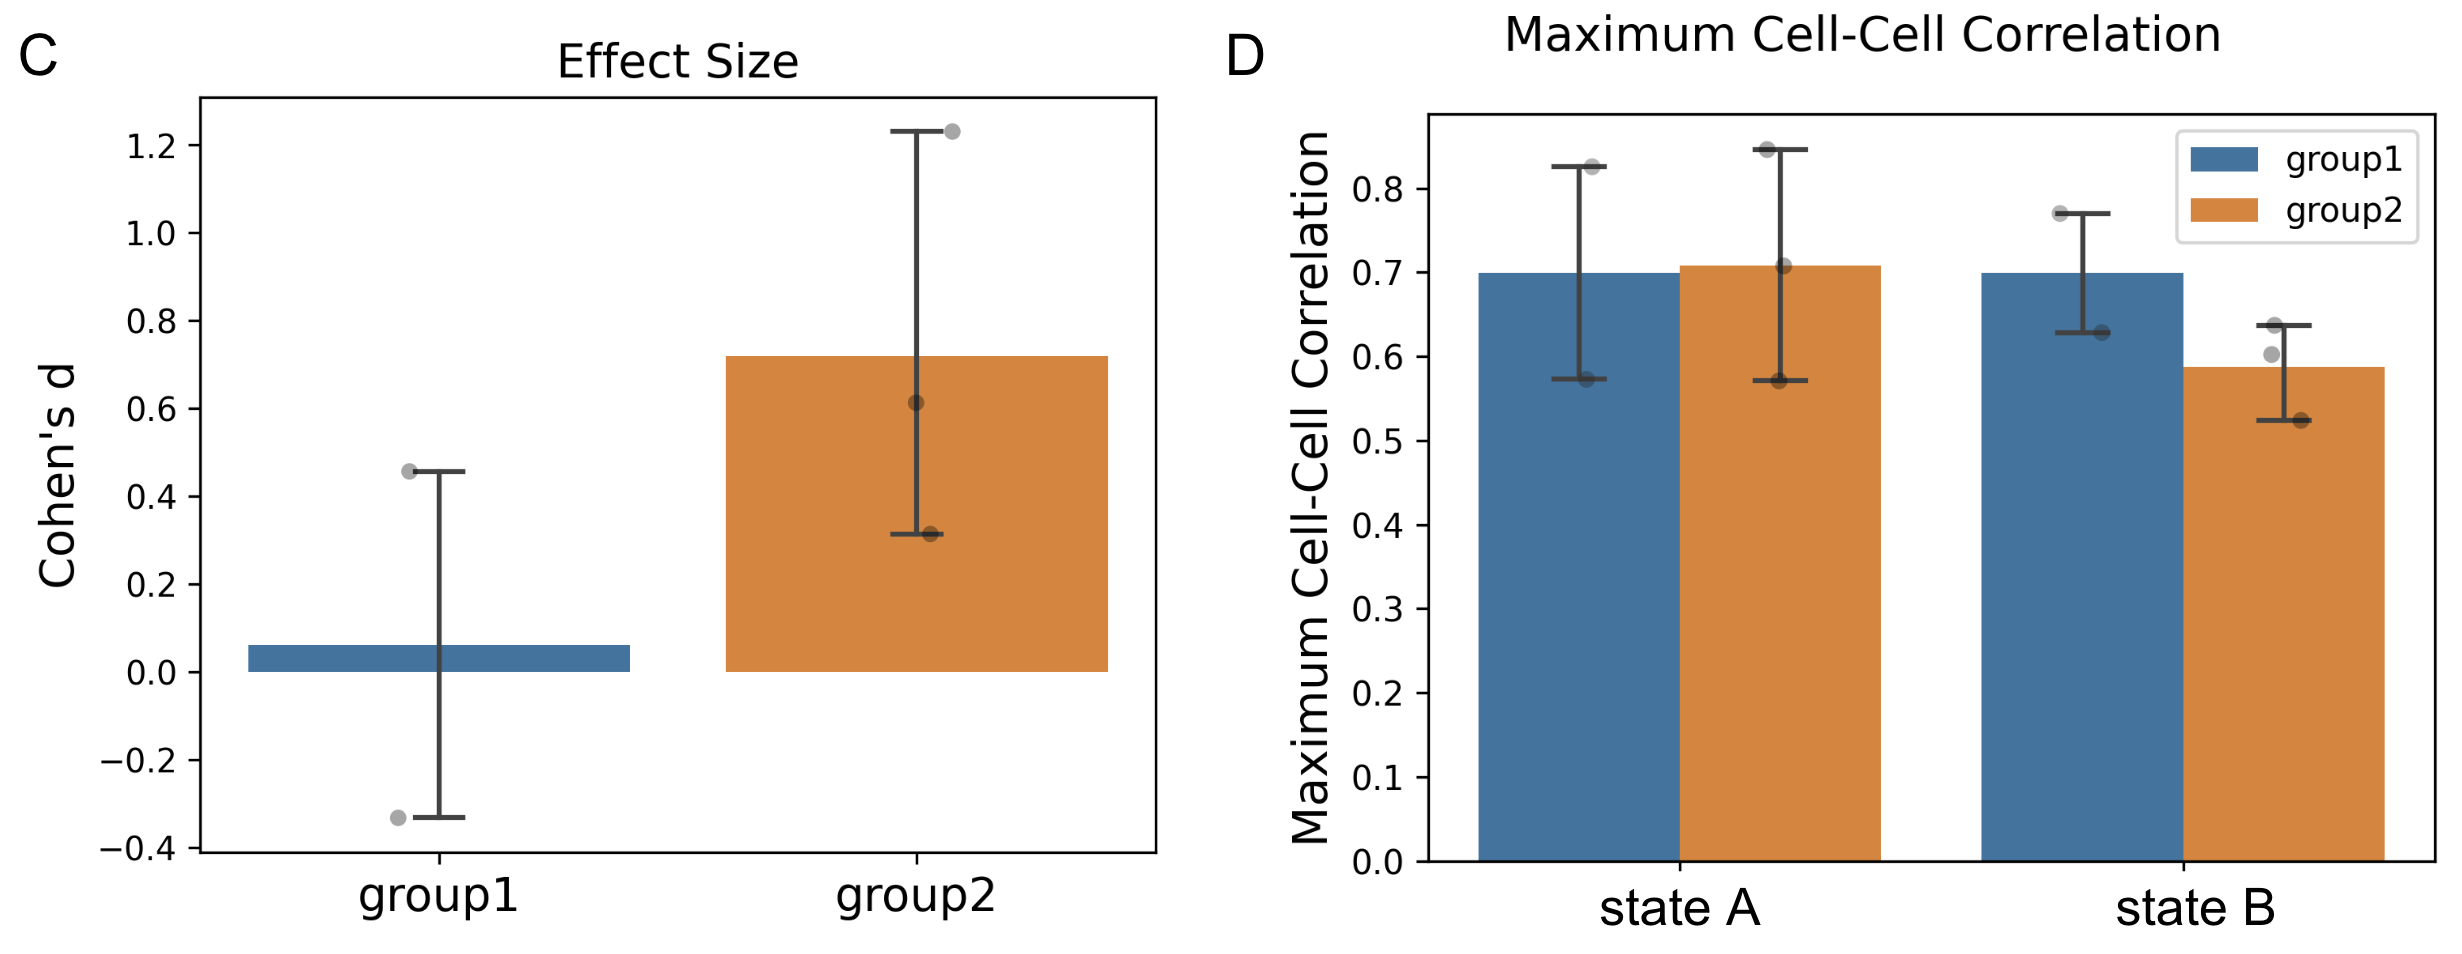
Comparison Figures
Legend
| Panel | Description |
|---|---|
| A | Combined data for the first input group. The cumulative distribution function of the maximum cell-to-cell correlation is plotted on the left panel. The right panel shows the maximum cell-to-cell correlation observed in each state, with each dot representing an individual cell. |
| B | Combined data for the second input group. The cumulative distribution function of the maximum cell-to-cell correlation is plotted on the left panel. The right panel shows the maximum cell-to-cell correlation observed in each state, with each dot representing an individual cell. |
| C | Comparison of the effect size between the two input groups. The mean ± sem is plotted along with the individual data points, each representing a recording session. |
| D | Comparison of the maximum cell-to-cell correlation between the two input groups. The mean ± sem is plotted along with the individual data points, each representing a recording session. |
Output Data
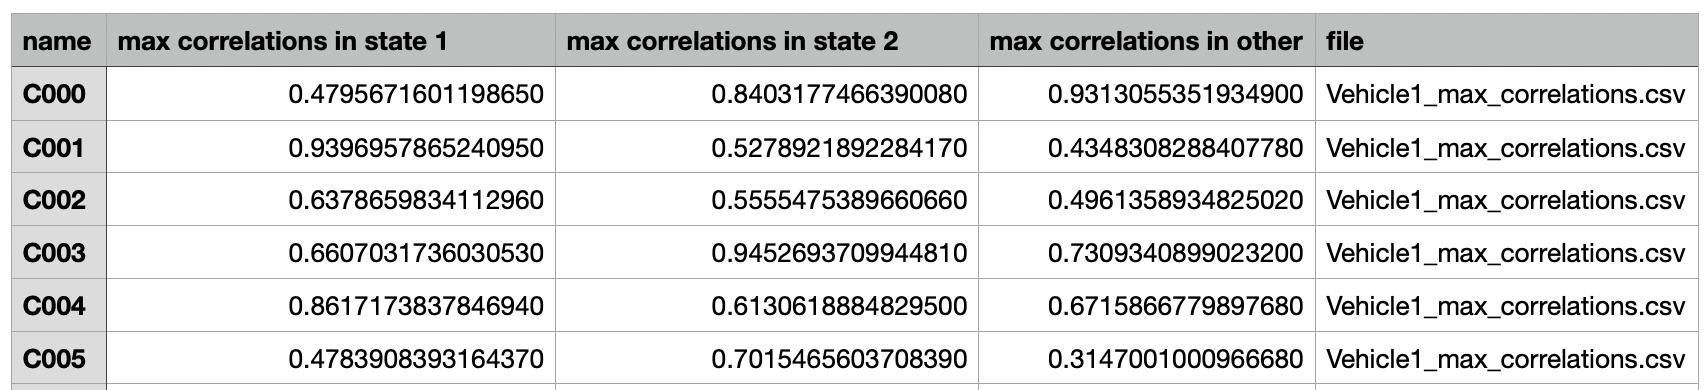
Combination Data
A csv file containing the correlation data of all cells in the group.
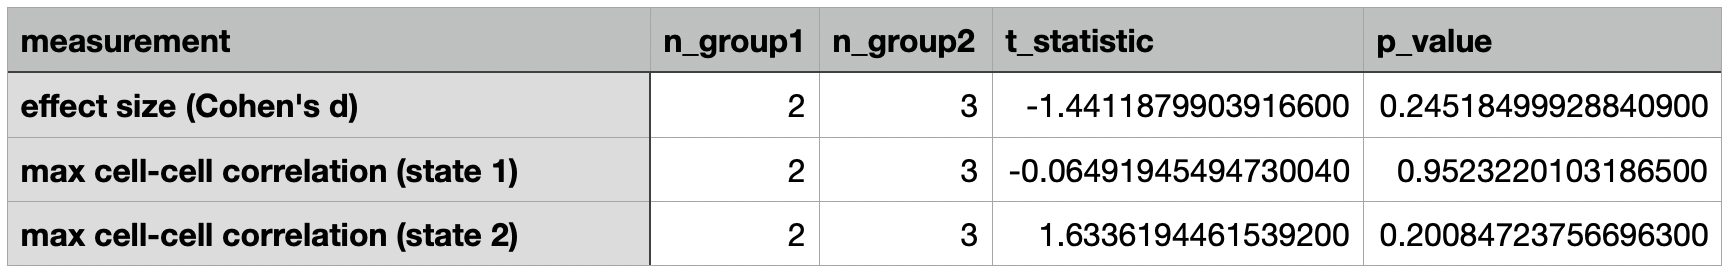
Comparison Data
A csv file containing a summary of the statistical tests performed.