Compare Neural Circuit Correlations Across States
This tool uses 1.0 compute credits per hour.
Overview
Compare Neural Circuit Correlations Across States tool calculates pairwise correlations between cell traces within a cell set for each specified state. It uses activity during the states indicated in the annotation file to find these correlations. The tool then compares the differences in correlations during these states.
Input Data
To run this tool, IDEAS users must have an .isxd cell set
file and a synchronized annotation file.
Valid Inputs
| Source Parameter | File Type | File Format |
|---|---|---|
| Cell Set Files | cell_set | isxd |
| Annotations File | experiment_annotations | parquet |
Generating synchronized annotation files
You can generate the synchronized annotation file by running one of these synchronization tools:
Parameters
This tool can accept no state, a single state, or two states. If no state is specified, correlations will be calculated across the entire recording. Otherwise, correlations will be calculated for each state identified and during a non-state period. It is important to note that if there are fewer than 10 frames in the recording during a particular state, correlations will not be calculated for that state. If there are more than 10 frames of data that is not assigned to any state, a "non-state" will be created. If only one state is specified, the effect size will be calculated between that state and the "non-state". If two states are specified, the effect size will be calculated between the two states.
| Parameter | Required? | Default | Description |
|---|---|---|---|
| Cell Set Files | True | N/A | ISXD cell set file(s) |
| Annotations File | False | N/A | File containing annotations about states, synchronised to ISXD cell set file |
| Column Name | True | state | Column name in annotations file that identifies state |
| State A | False | N/A | Name of first state |
| State B | False | N/A | Name of second state |
| Statistic | True | max | Statistic of correlation to compare (max, mean or min) |
Algorithm details
Cell Statuses
Individual cell statuses stored in the input cell set are used to determine which cells to include in the analysis. If there are accepted cells, only accepted cells will be used. If there are no accepted cells, only undecided cells will be used. If all cells are rejected, the workflow will raise an error to inform the user.
Outputs
The tool will generate the following outputs:
| File | Format | Description |
|---|---|---|
| Maximum correlations data file | CSV | the maximum correlations found in each state, as well as during the non-state period as columns, cells as rows |
| Raw correlations data file | HDF5 | A HDF5 file containing raw correlation matrix for each state |
Previews
The tool will also generates two previews of the output data:
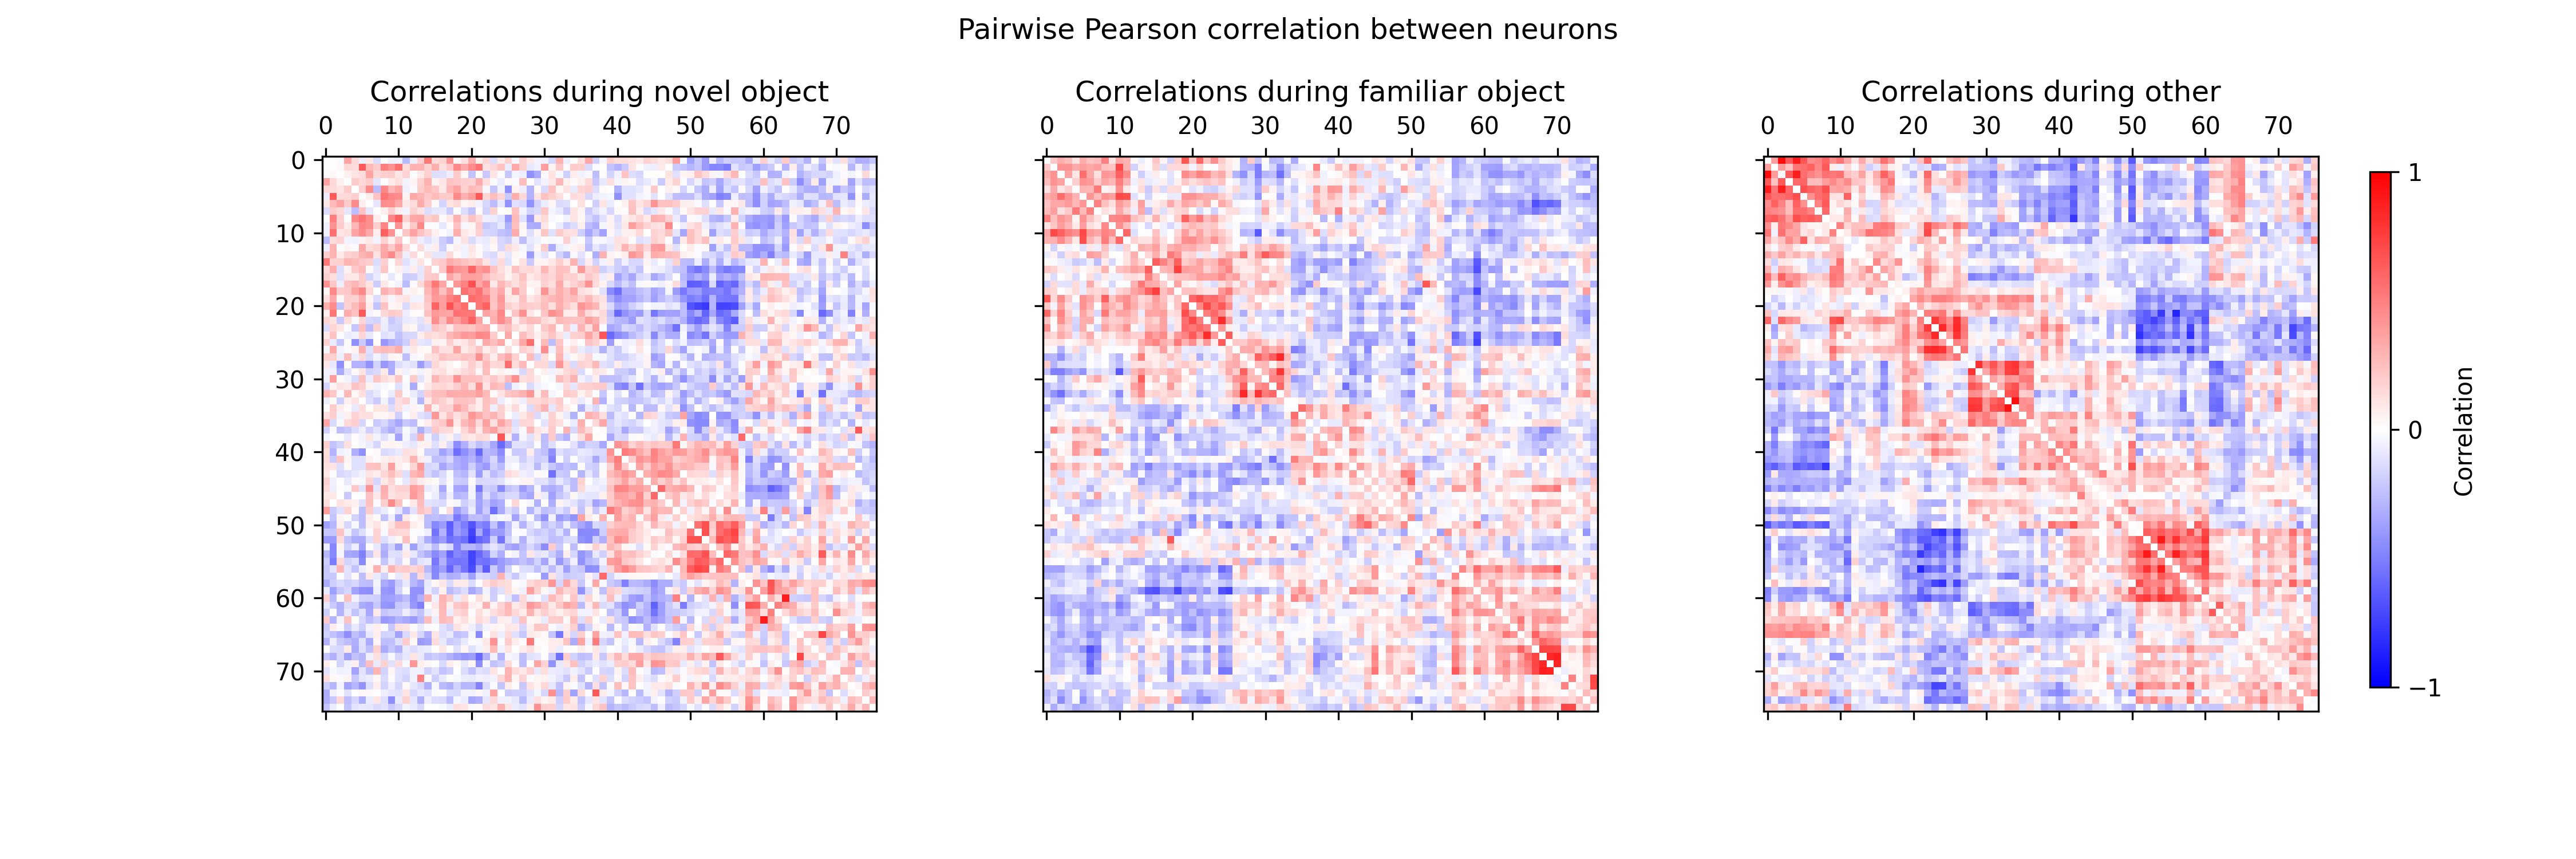
Correlation Heat Maps
This preview will display correlation heat maps for each state specified in the annotation file and a heat map for all data not in any specified state. The data points are reorganized using hierarchical clustering so that groups of highly correlated variables are next to each other. The diagonal entries in the correlation matrices are set to zero.
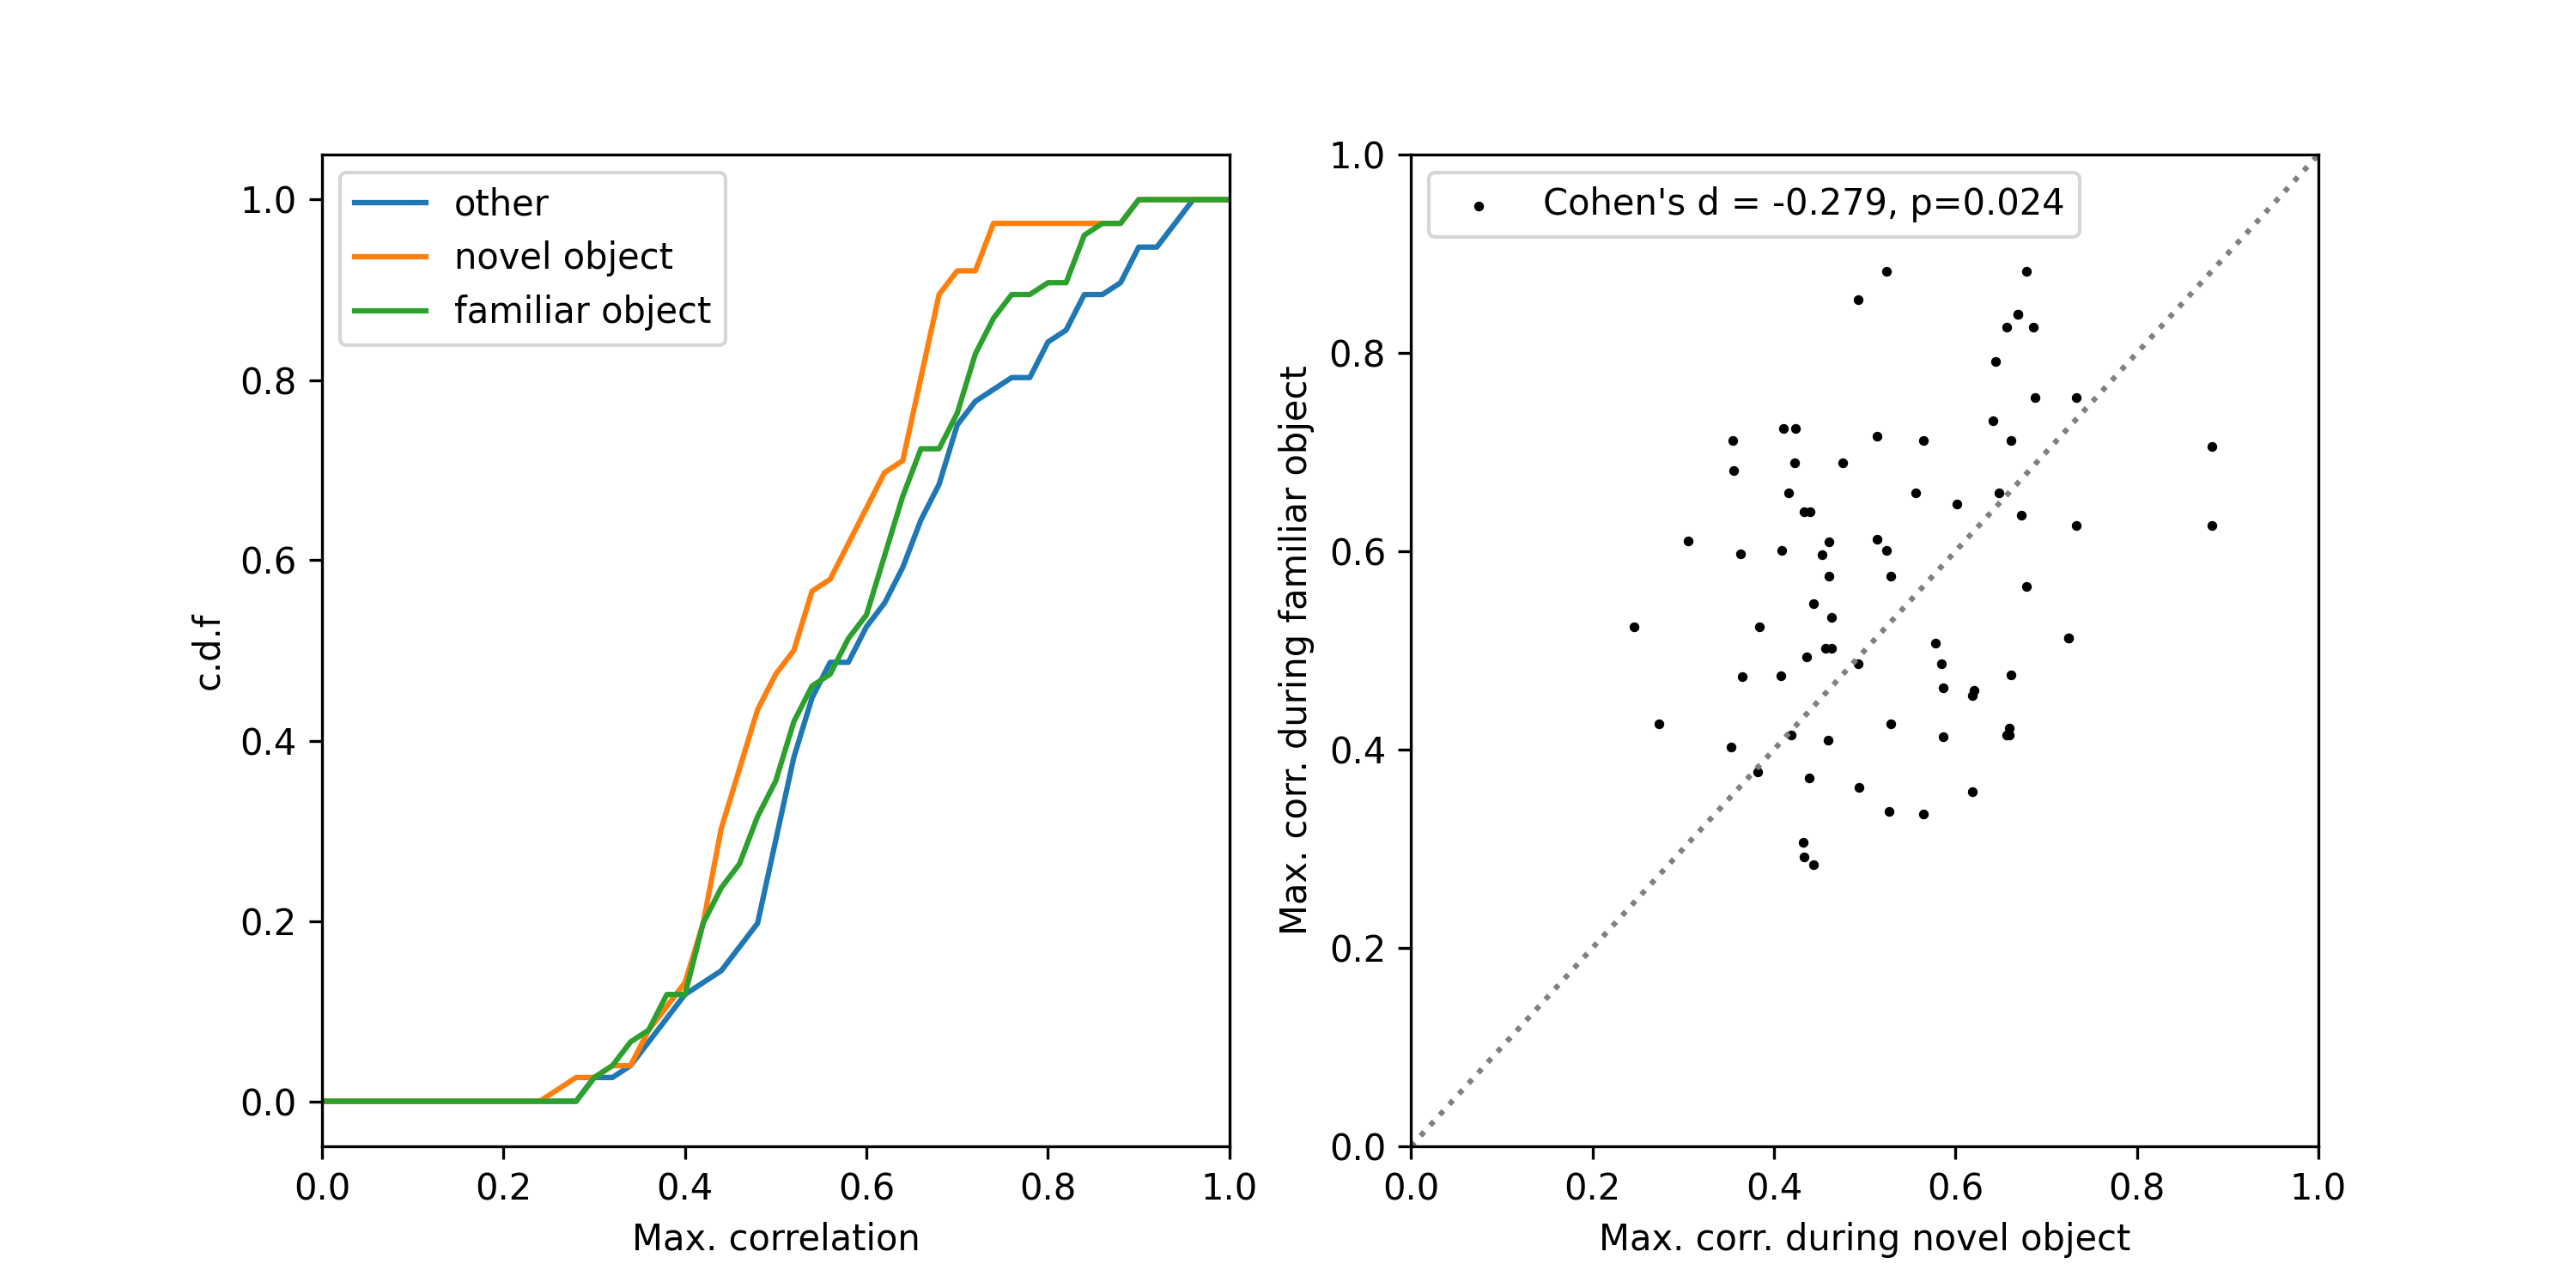
Effect Size
This preview consists of two plots.
The first plot shows the cumulative distribution function (CDF) of the correlation for each state specified.
The second plot shows a scatterplot of the max correlation during State 1 compared against State 2, and shows the Cohen's d and p-value between the two populations.