Compare Neural Activity Across States
This tool uses 1.0 compute credits per hour.
Overview
The Compare Neural Activity Across States tool during states tool calculates the average modulation during user specified states. Specifically, this tool calculates the modulation of neurons during each state and validates modulation by permutation testing. It then uses the significance of the modulation scores to identify whether each neuron is up or down regulated during these states.
Input Data
This tool accepts either a single state, or two opposing states. If only one state is specified, the function will compare activity levels against a placeholder state of random periods of the recording not during the specified state the same length as the specified state. If two states are specified, the function will compare the activity levels of the two states against each other.
Valid Inputs
| Source Parameter | File Type | File Format |
|---|---|---|
| Cell Set File(s) | cell_set | isxd |
| Annotations File | experiment_annotations | parquet |
Generating synchronized annotation files
You can generate the synchronized annotation file by running one of these synchronization tools:
Parameters
| Parameter | Required? | Default | Description |
|---|---|---|---|
| Cell Set File(s) | True | N/A | ISXD cell set file(s) |
| Annotations File | True | N/A | Experiment Annotations file |
| State A | True | N/A | Name of first state to analyze. This state should exist in the annotations file. |
| State B | False | N/A | Name of second state to compare against (optional). If blank, comparison will be made to times not in state A |
| Column Name | True | state | Column name in annotations file with states |
| Number of Shuffles | False | 1000 | Number of shuffles to determine if a neuron is significantly modulated by state |
| Significance Threshold | False | 0.01 | Significance threshold (alpha) below which p-values are considered significant. |
| Parameter | Required? | Description |
|---|---|---|
| Input files: Cell Set File | Yes | Cell set file .isxd to analyze, or series of cell set files. |
| Input files: Annotations File | Yes | corresponding synchronized annotations.parquet file generated by previous synchronization analysis |
| States: State A | Yes | Name of the first state to compare |
| States: State B | No | Name of the second state, if any to compare against the first state |
| Parameters: Number of shuffles | No | Value that defines the number of shuffled to perform during the permutation testing. Default value is 1000 |
| Parameters: Column Name | No | Name of the column where the state data is. Default value is "state" from the synchronization tool |
Algorithm details
The tool uses several metrics to measure and analyze population activity, described in the following sections
Average measures
When the activity of a cell is measured, the mean of the calcium trace is used.
Modulation score
The modulation score is calculated using a difference/sum formula. Specifically
Significance level
The significance level is determined using circular permutation, where the state labels are shuffled and the modulation score is recalculated. The p-value is calculated as the minimum between the proportion shuffeled scores greater than the original score and the proportion of shuffled scores less than the original score.
This means that the specificity of the p-value is determined by the number of shuffles performed. (e.g. 1000 shuffles will give a p-value with a resolution of 0.001)
Cell Statuses
Individual cell statuses stored in the input cell set are used to determine which cells to include in the analysis. If there are accepted cells, only accepted cells will be used. If there are no accepted cells, only undecided cells will be used. If all cells are rejected, the workflow will raise an error to inform the user.
Outputs
The tool will return a .csv file with individual cells as rows, and the columns for each state analyzed. If only one state is provided, then state 2 will be a placeholder state for "not during state". The columns will contain the average activity of each cell in each state, the modulation score, p-value, and modulation identity for each cell in each state.
An example output file looks like this:
| name | State 1 raw modulation score | State 1 p-value | State 1 modulation identity | State 1 mean activity | State 2 (or placeholder) raw modulation score | State 2 p-value | State 2 modulation identity | State 2 mean activity |
|---|---|---|---|---|---|---|---|---|
| C000 | -0.057537501 | 0.256 | 0 | 8.013278525 | 0.055948157 | 0.204 | 0 | 10.88235528 |
| C001 | 0.321526855 | 0.006 | 1 | 14.86207092 | 0.140212216 | 0.058 | 0 | 8.404072915 |
| C002 | -0.218330082 | 0.002 | -1 | -3.856631176 | -0.020360241 | 0.24 | 0 | 0.290256447 |
Previews
The tool will also generate two previews of the output data:
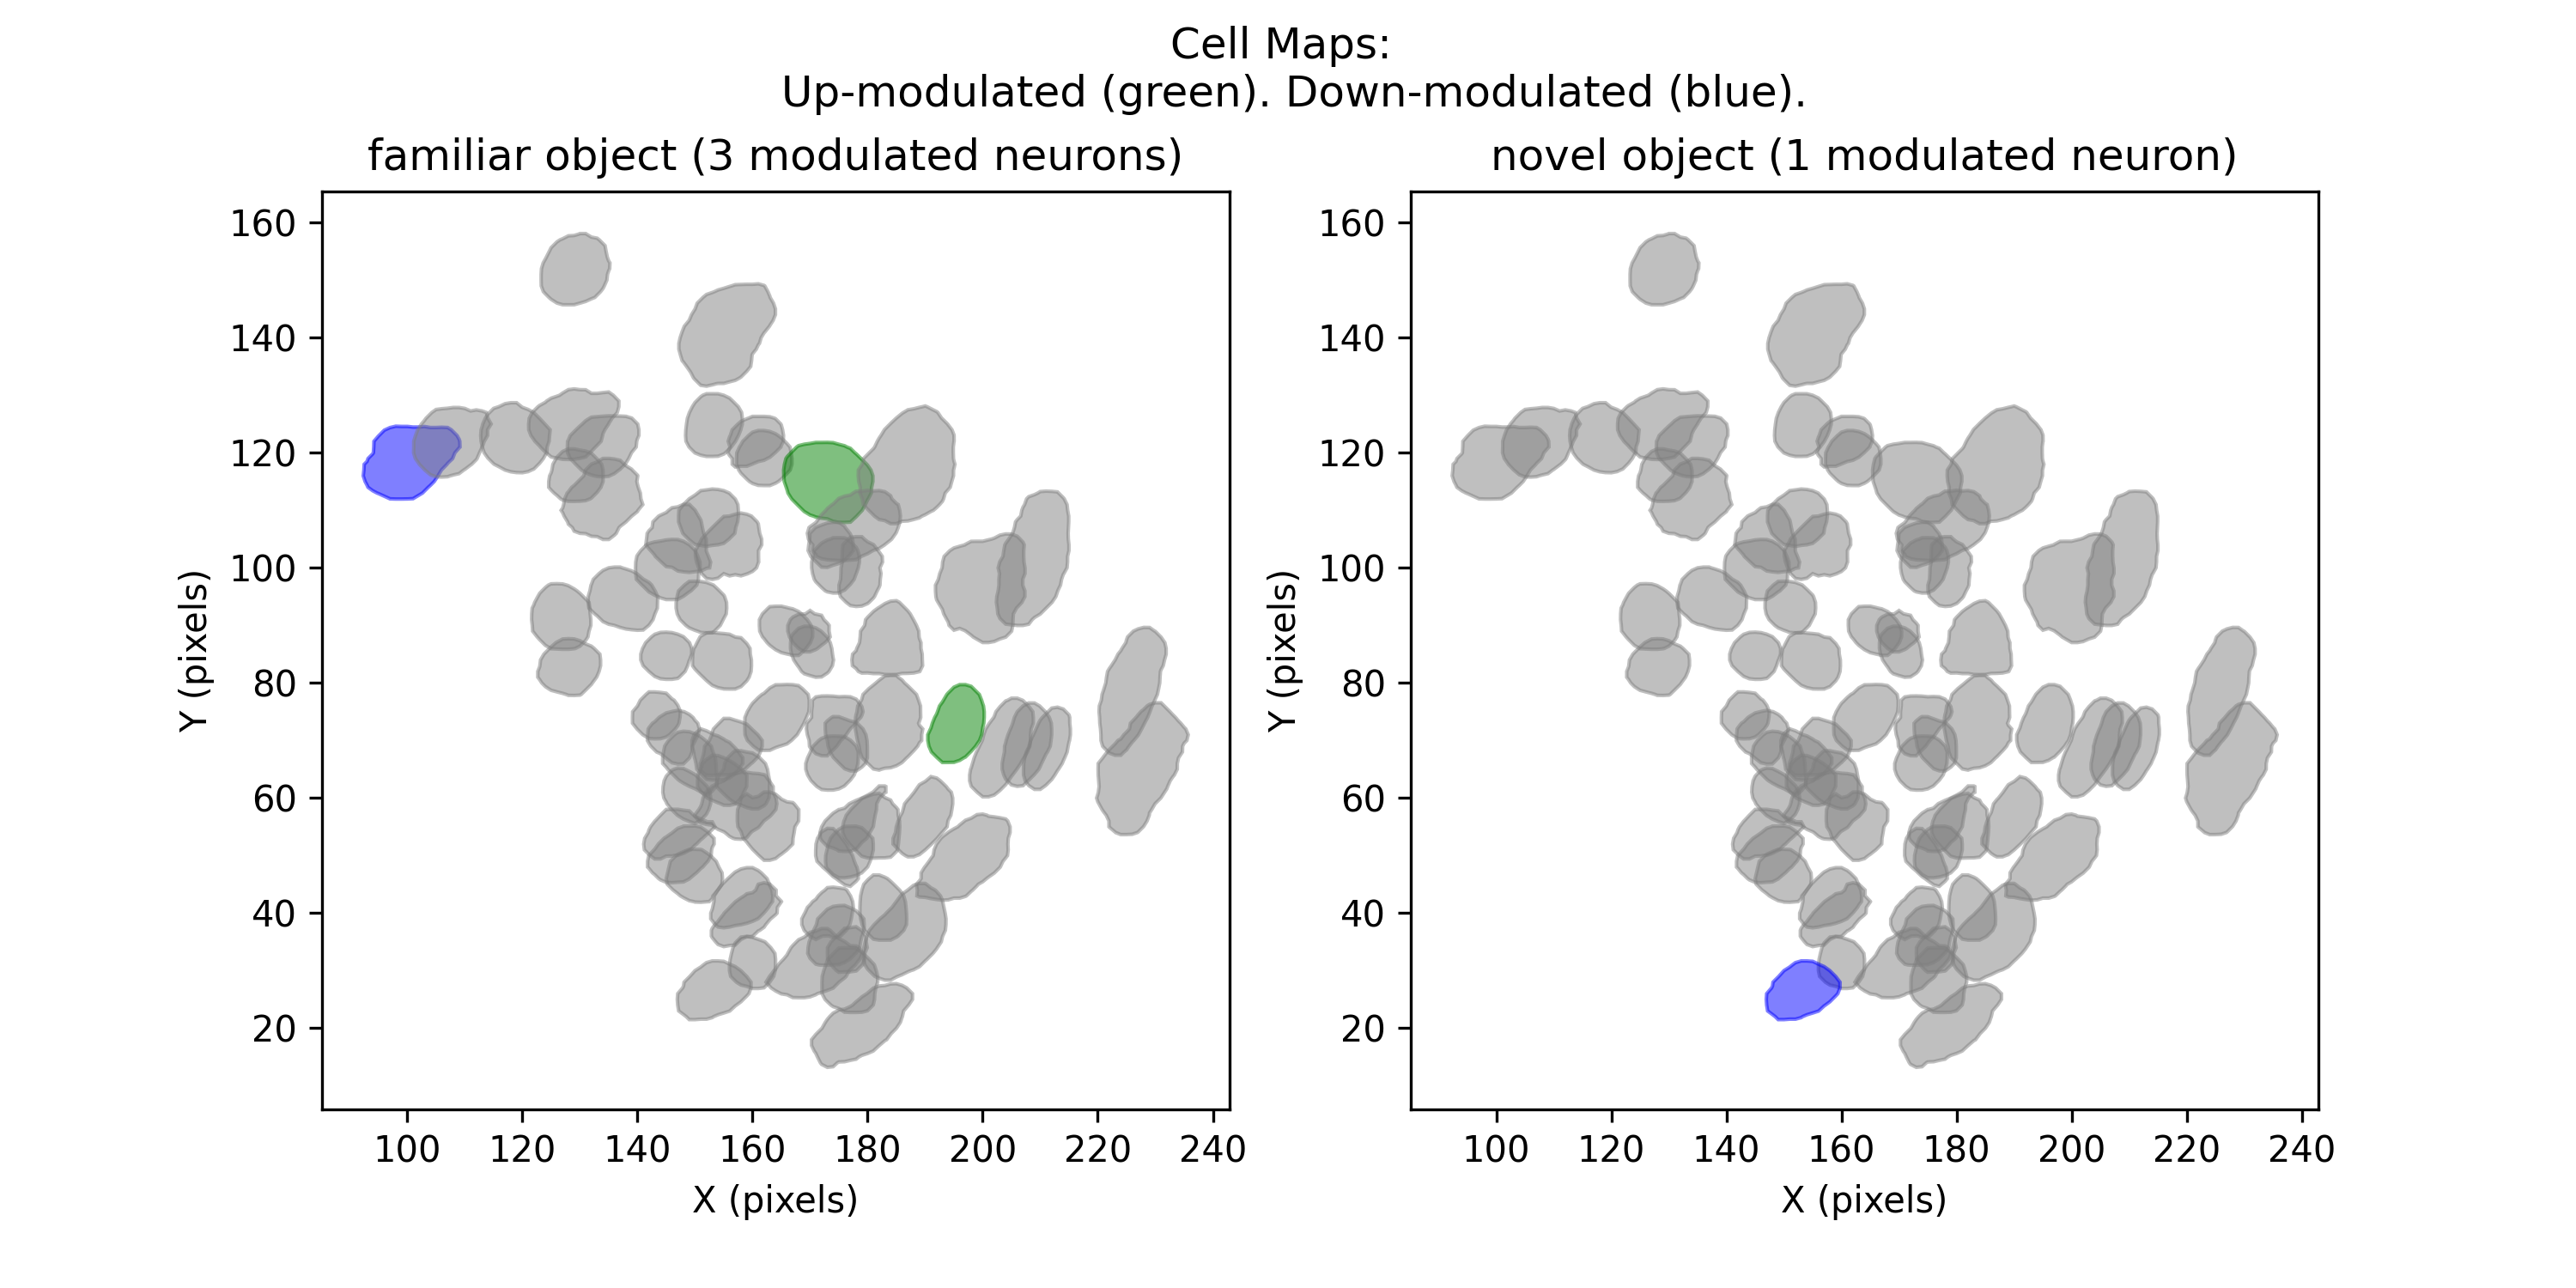
Cell Maps
This preview will display two panels. Each panel will show cell footprints from the cell set, and highlight footprints of up- or down-regulated cells during each state.
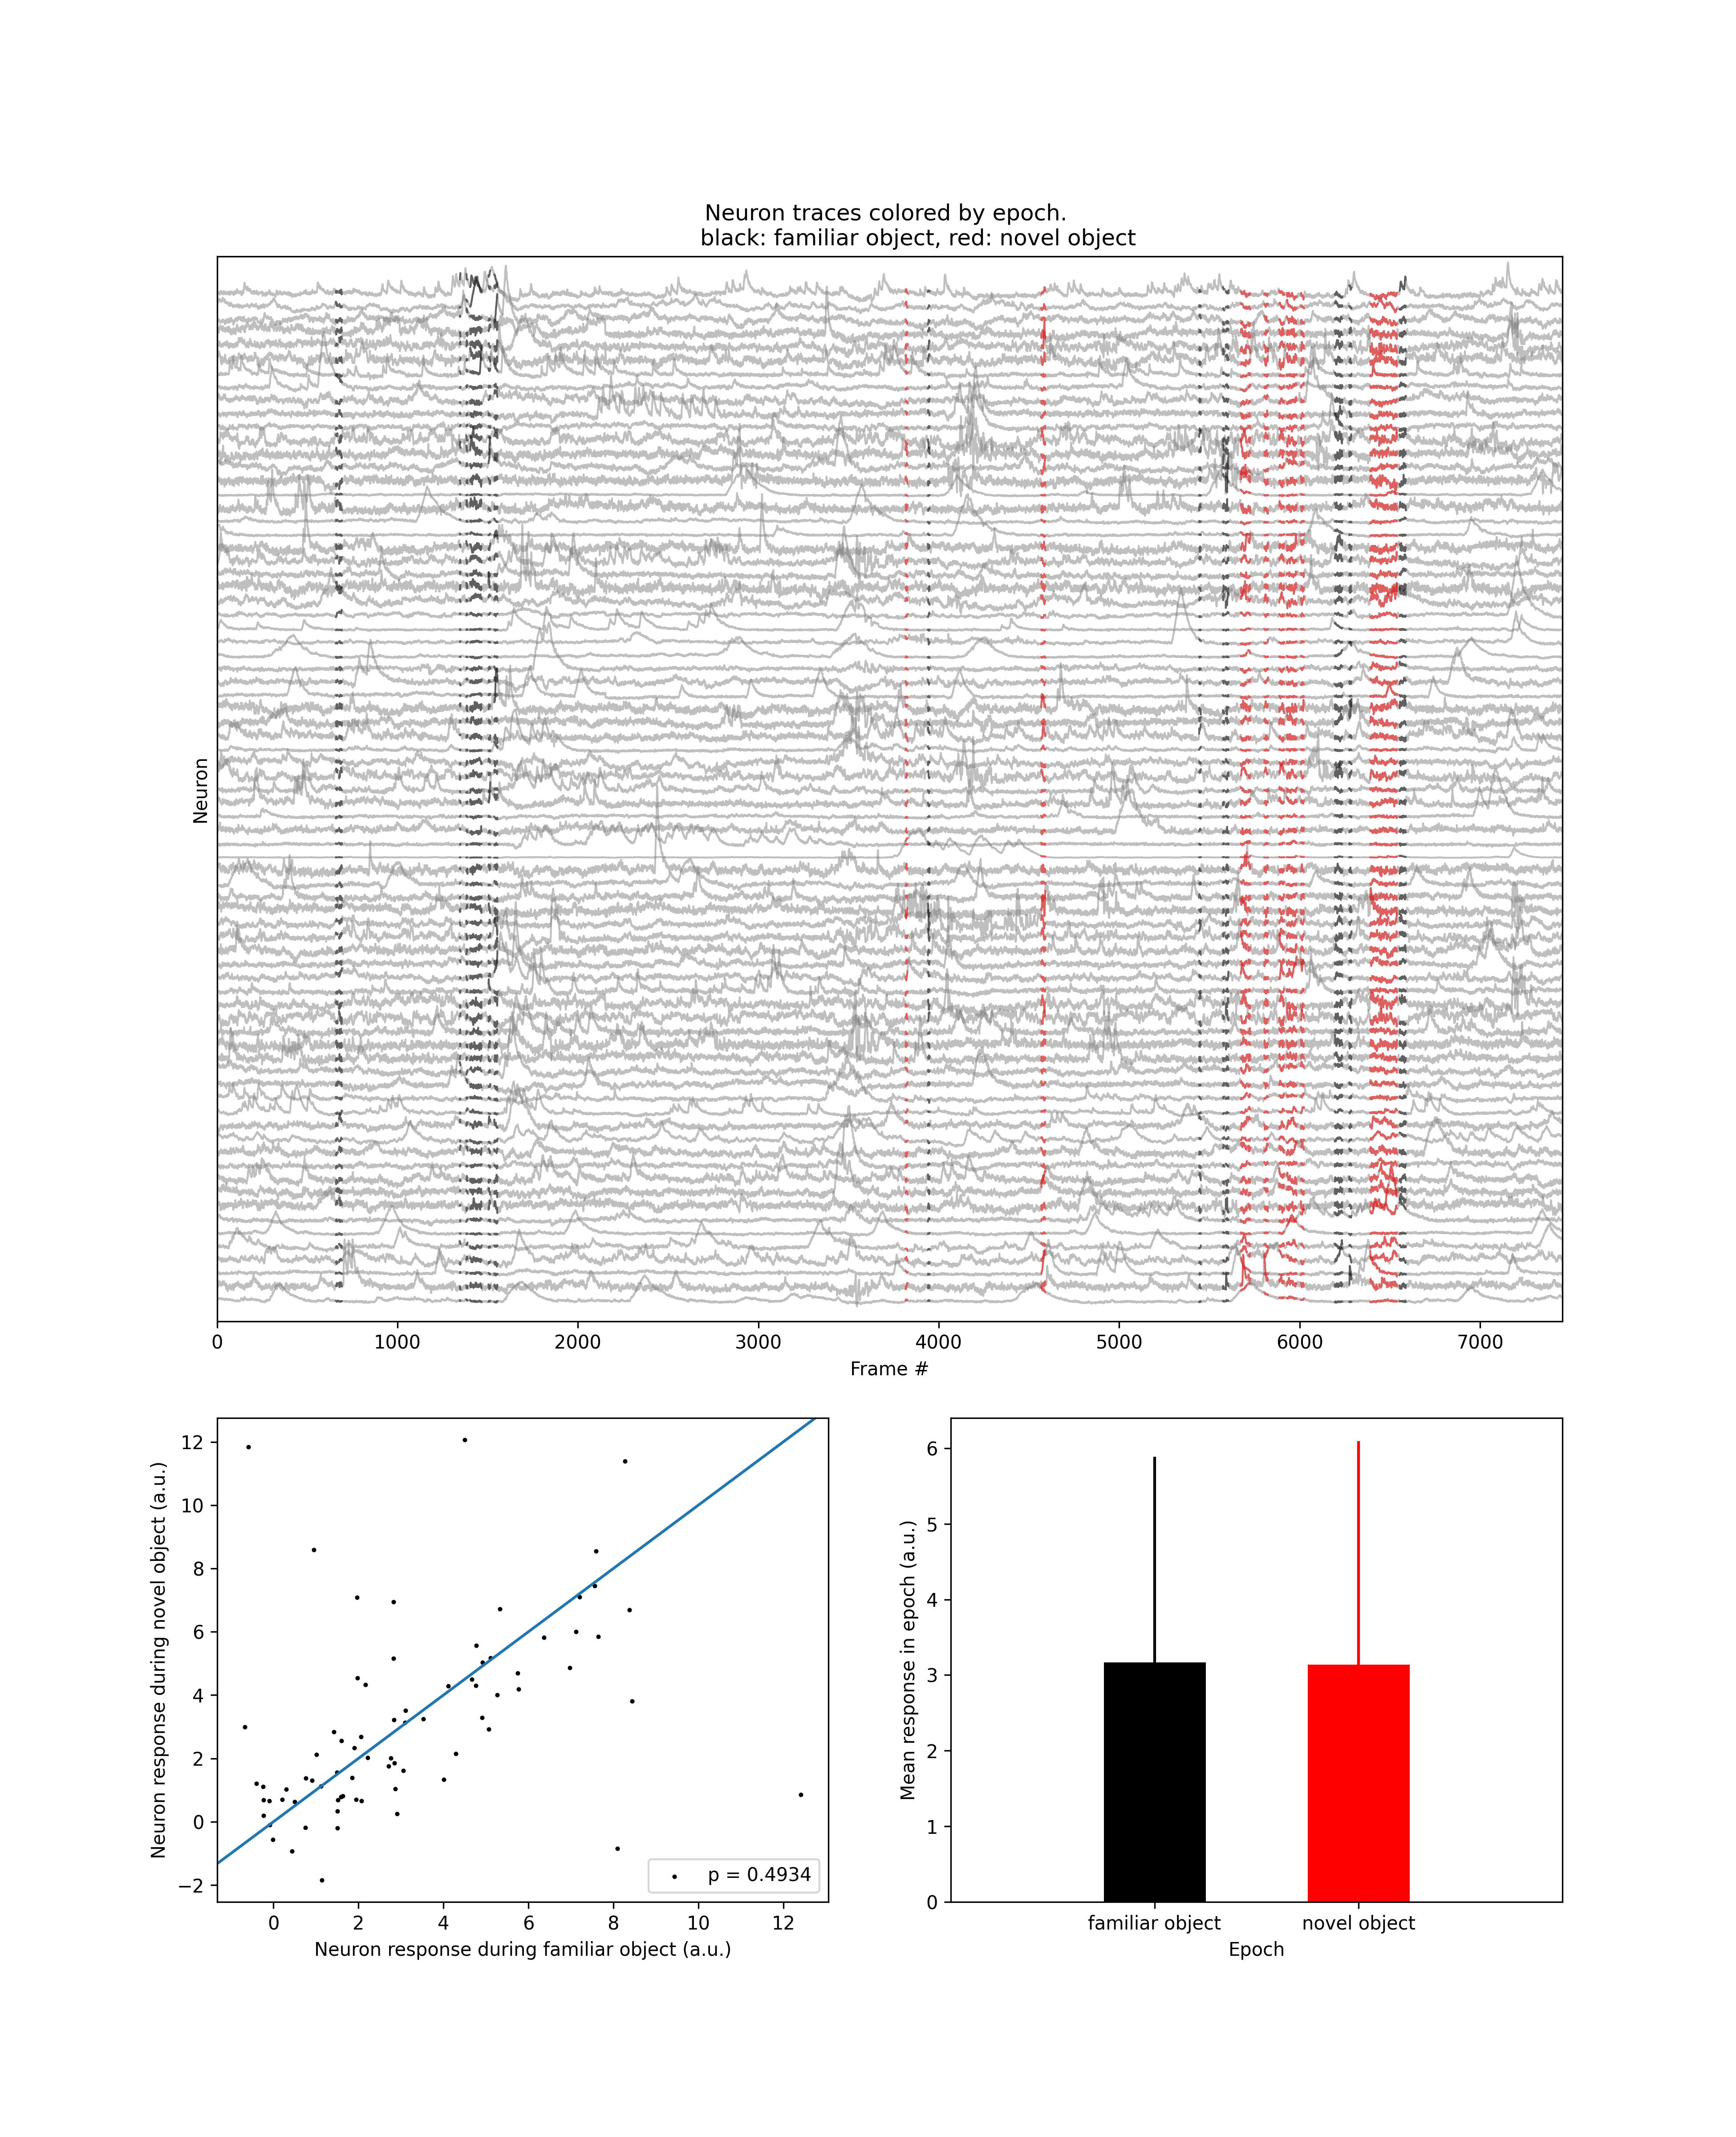
Neuron traces
This preview consists of three panels. The top panel displays the traces of all neurons (gray). The two states are shown in red and black. The bottom left panel shows a scatter plot of neuron activity in the two states. Each dot is a single neuron. The bottom right panel shows a bar plot of average neuron response in each state.