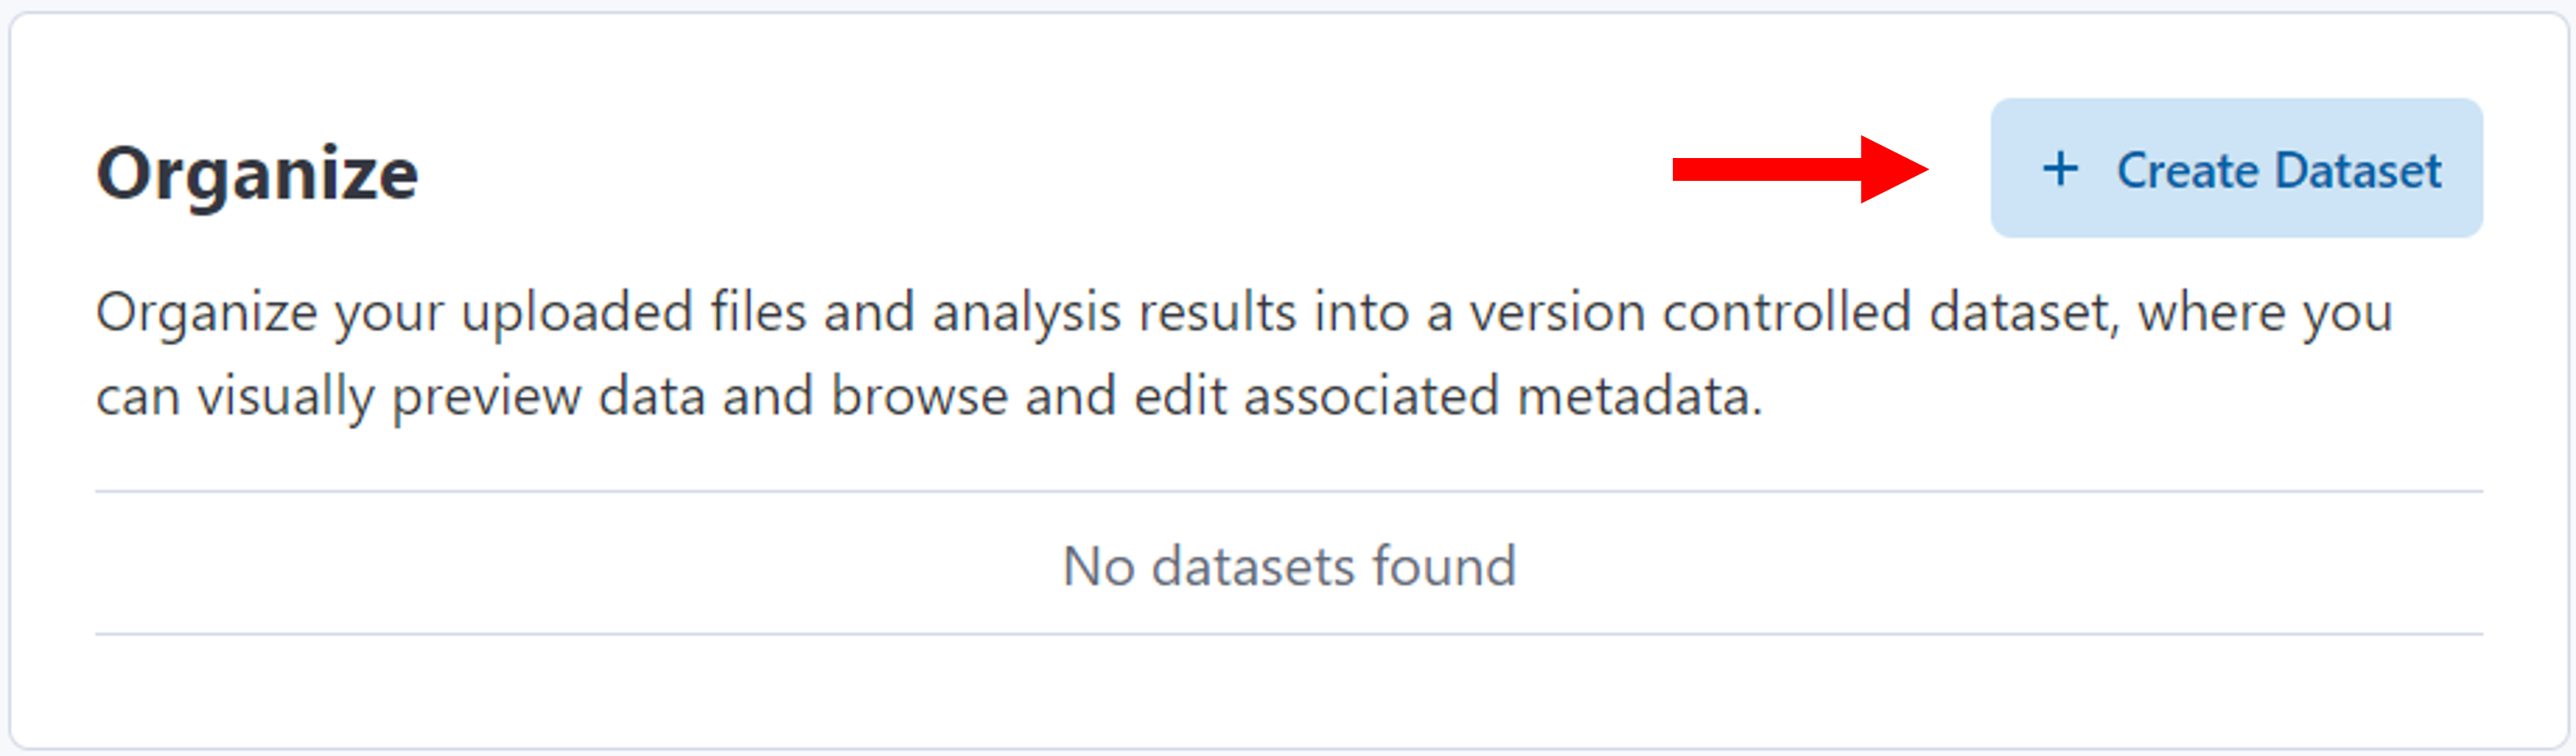
Create a dataset
After generating a project, create one or more datasets. A dataset will contain a table with data for analysis.
Click Create Dataset.
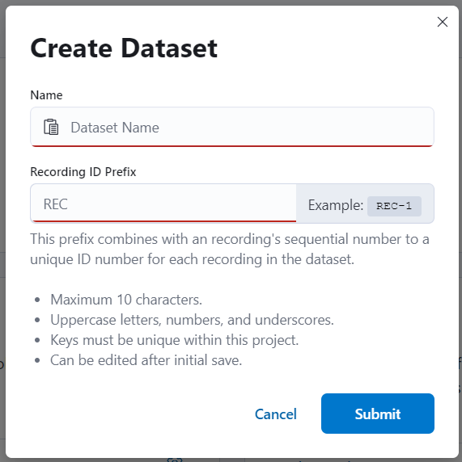
You will be prompted to enter a name and recording ID prefix for the dataset.
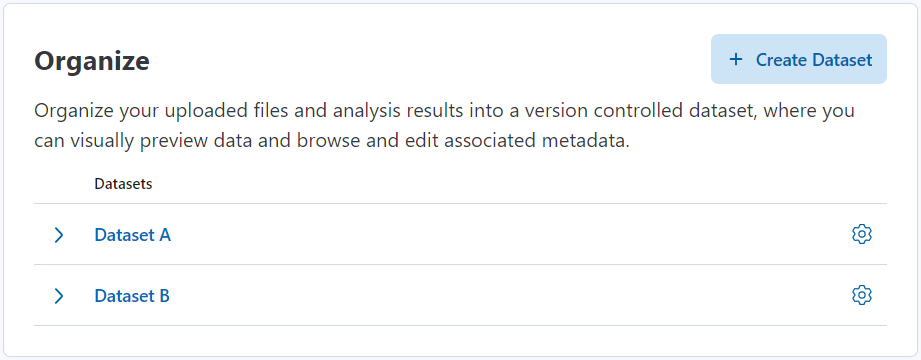
After clicking Submit, the dataset will appear in the list on the Organize panel. Edit the dataset name using the gear icon. You can create more than one dataset.
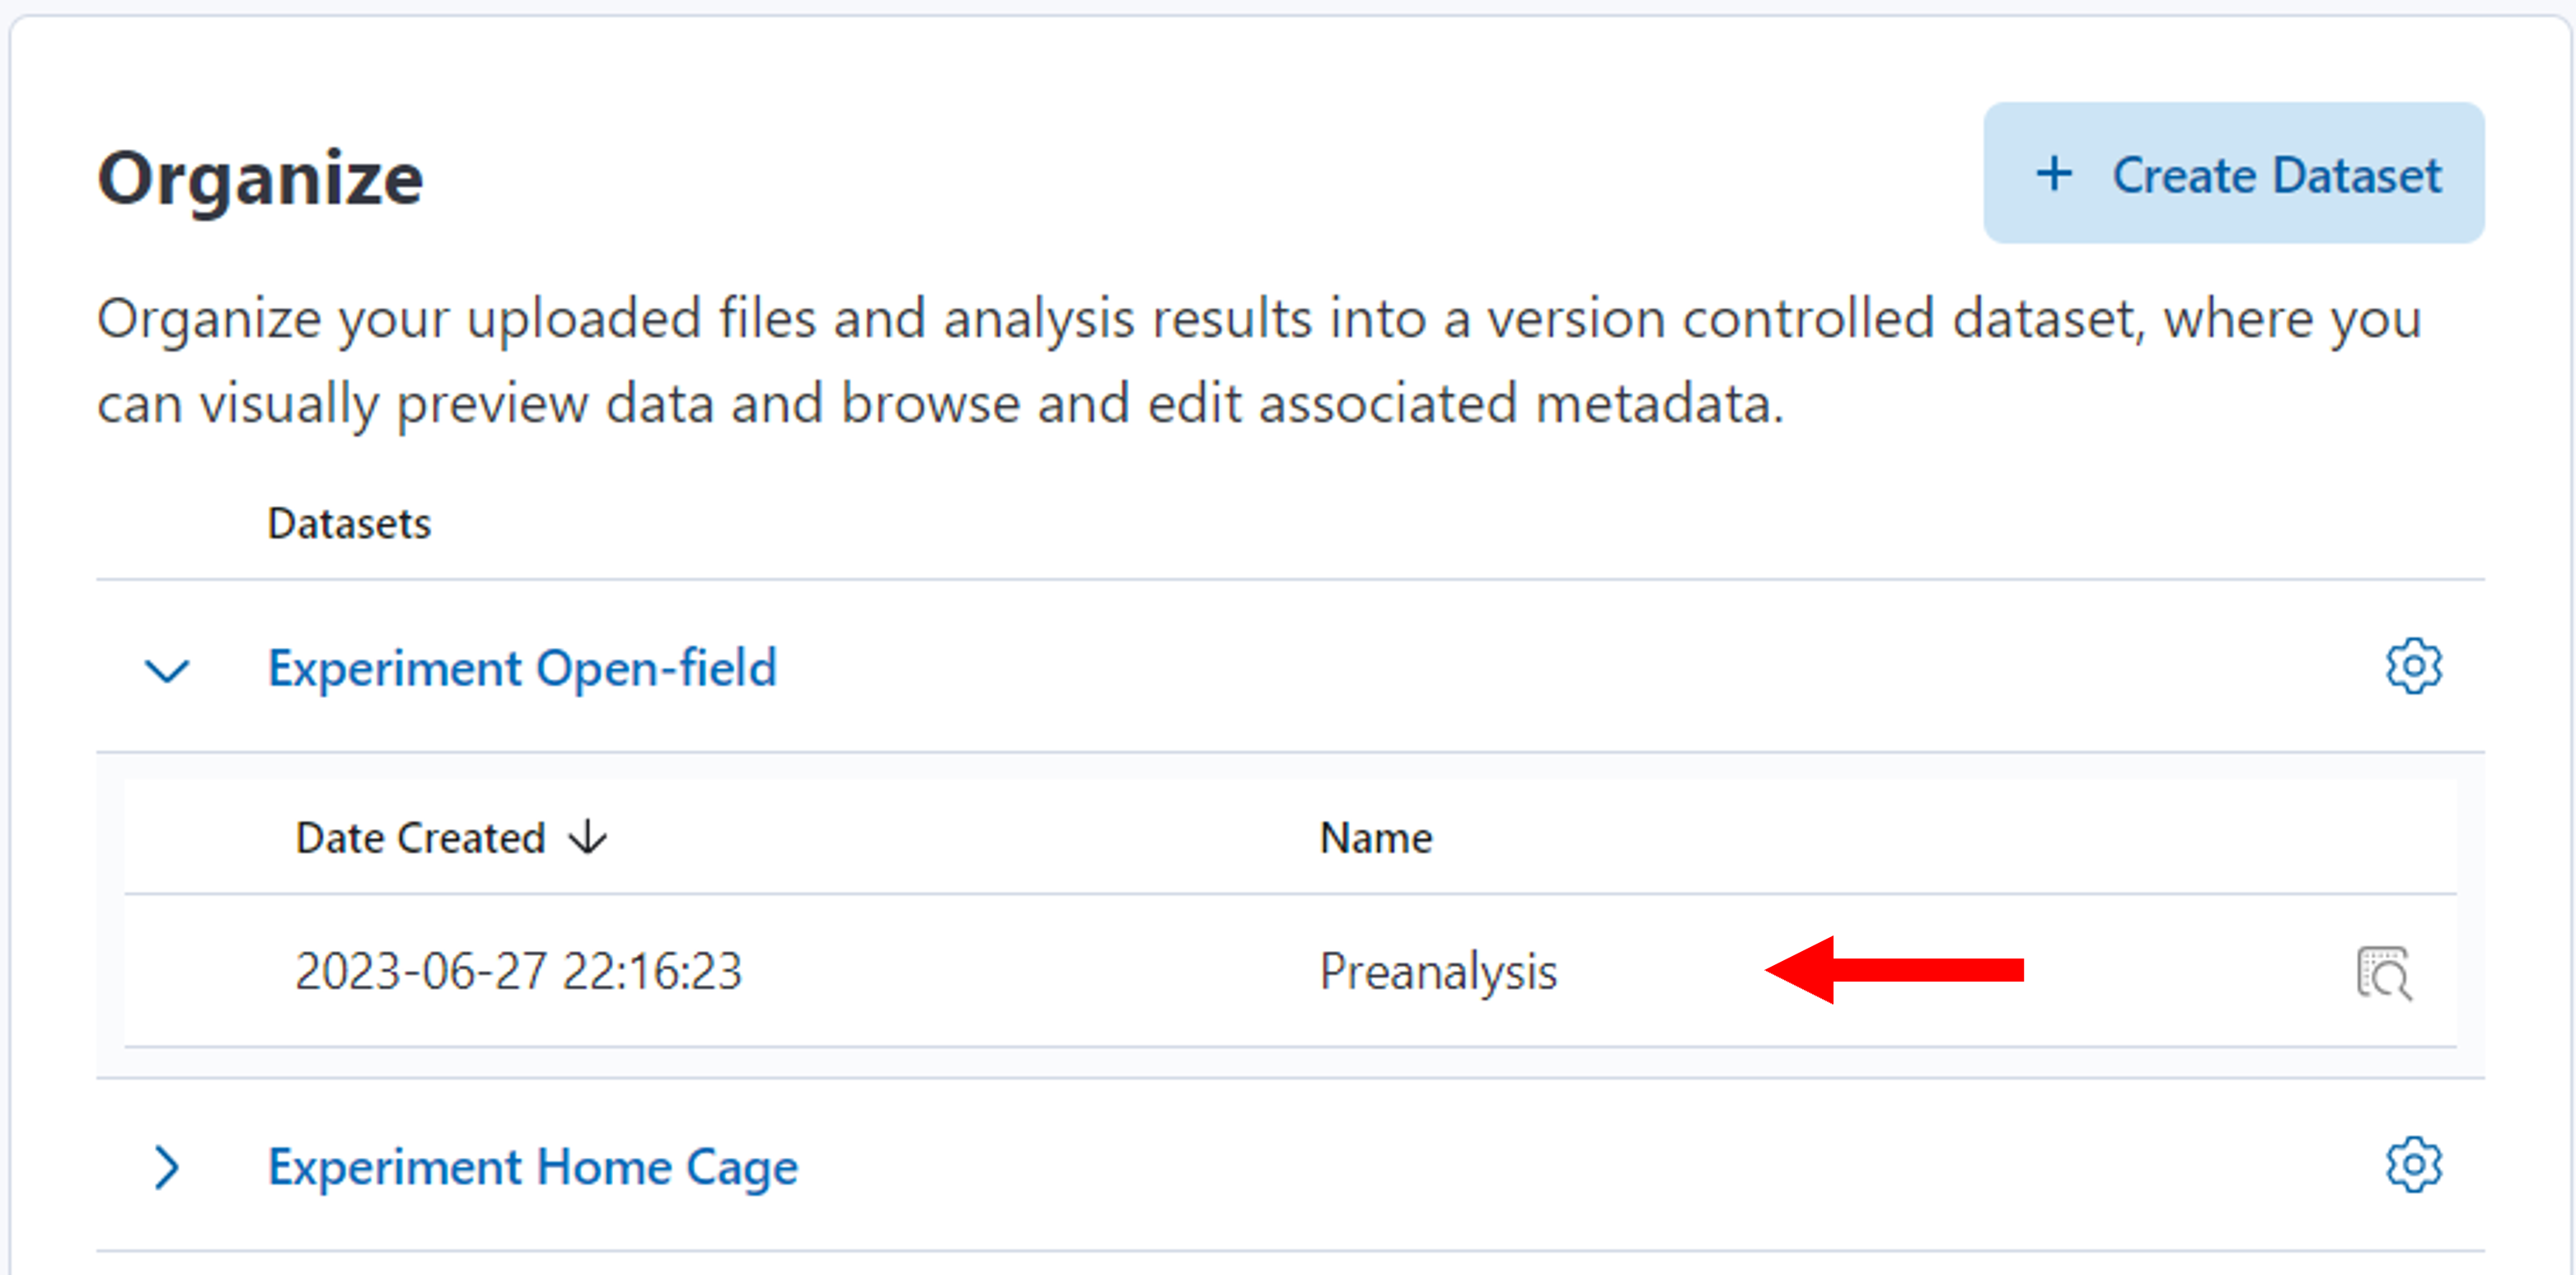
Datasets can be version controlled. Use the accordion to view previous versions as shown in the example below.
Dataset table
Click on a dataset to navigate to the dataset table. Initially the table will be blank, but it can be populated with various types of data including miniscope recordings, imu, gpio data, as well as experiment and analysis metadata.
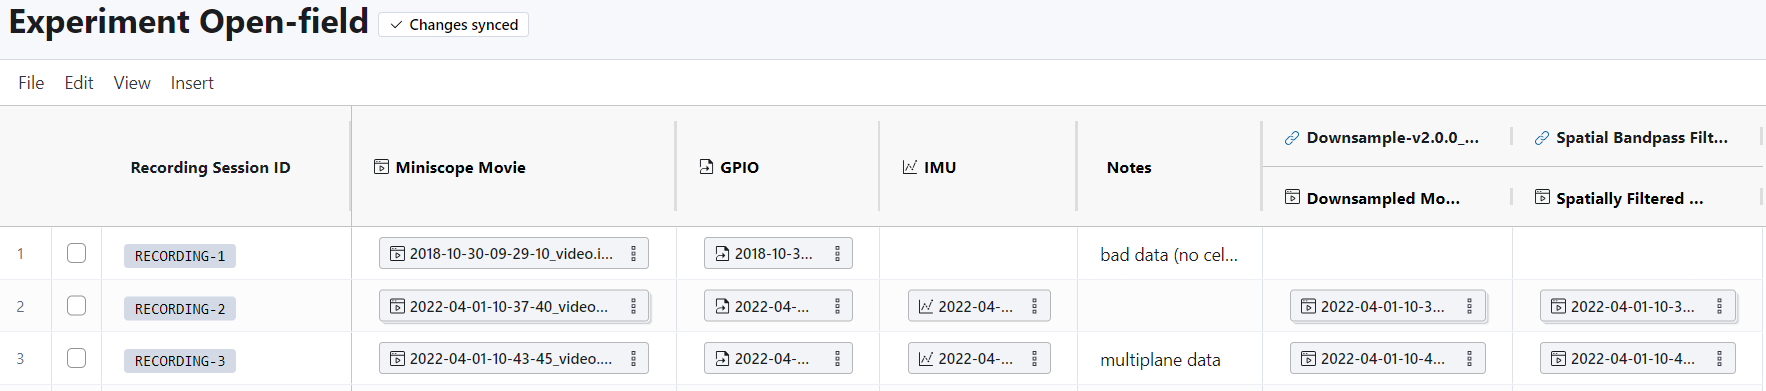
Each row of the table is a Recording which represents a collection of related data. Columns can be customized to describe the data you want associated with each Recording. For example, you may choose to add columns for a miniscope movie and details pertaining to your experimental conditions (e.g., dosing, condition, subject ID, etc.). After running analysis workflows, results can be linked to data in the dataset table. Depending on the complexity of your data, your dataset table may be large with many columns and/or rows of data.
Let’s use an example to see how you might use these tables to organize your data. Say you have an experiment evaluating a disease model with 12 mice and 5 imaging sessions (pre-disease state, post-disease state, 3 drug dose tests). You will have a collection of data to associate with each imaging session (miniscope raw movie, and results following analysis: cell sets and event sets). There are a few different ways this data could be organized in datasets:
- Create one dataset with 12 Recording rows (a row for each mouse) and 5 columns for each imaging session. Note that the columns would be replicated for each data type added to the dataset (5 columns for miniscope movies, 5 columns for cell sets, etc.).
- Create one dataset with 60 Recording rows (a row for each mouse + imaging session permutation). In this table, the number of columns is simplified (no longer have separate columns for each imaging session), but you have more rows. Note that this may get challenging to organize.
- Create multiple datasets - one for each imaging session. Each dataset would have 12 Recording rows (a row for each mouse)
An example data table is shown below.
Navigating the dataset page
Navigation bar
Use the navigation bar at the top to return to the project home page.
Menu bar
-
File
Save the current version of the dataset, download the table to a CSV file (only names of data will be exported), or export data to DANDI
-
Edit
Copy or delete selected rows
-
View
Quick links to the file browser, panel for viewing and running analysis workflows, notes for the dataset, and a list of previously saved versions of the dataset
-
Insert
Insert recording rows or columns for data, metadata, or analysis results
Toolbar

The bottom toolbar provides buttons to upload data, export data to DANDI, add notes to the dataset, view and run analysis workflows, and open file browser.